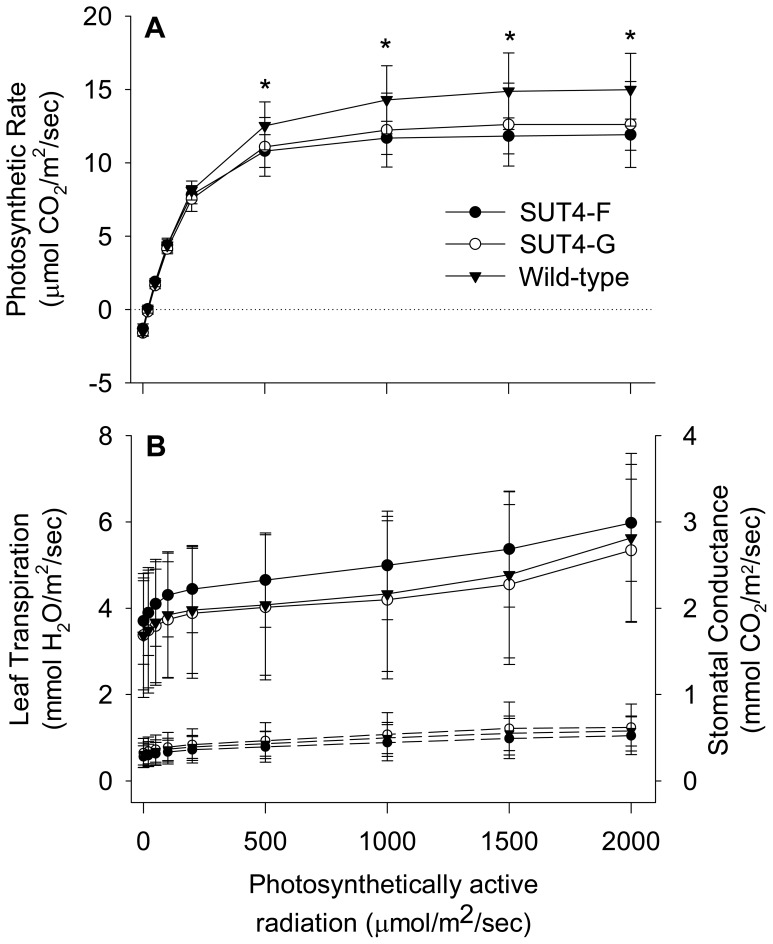
Figure 3. Leaf gas exchange properties of Populus wild-type and RNAi plants.
Light response curves for (A) Photosynthetic CO2 fixation, and (B) Leaf transpiration (solid lines) and stomatal conductance (dashed lines). A fully expanded source leaf (LPI-10) was used for the measurements. Data points are means ± SD of 19 WT, 10 line G, and 12 line F plants. * p≤0.05 for each transgenic line compared to wild type as determined by Student’s t-test.

