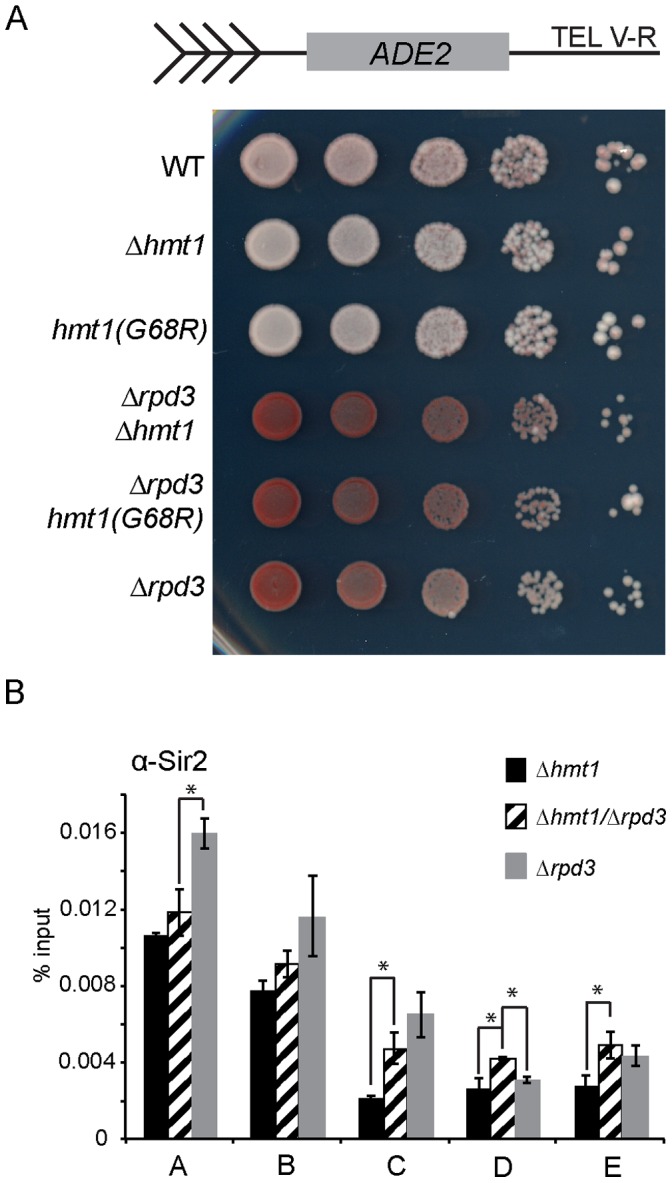
Figure 4. Epistatic analysis of silencing in Hmt1 and Rpd3 mutants.

A) Telomeric Silencing Assay comparing Δhmt1/Δrpd3 to either Δhmt1 or Δrpd3 single mutant. B) Sir2 occupancy across the telomeric boundary region in Δhmt1, Δrpd3, or Δhmt1/Δrpd3 mutants. ChIP was performed using anti-Sir2 antibody to immunoprecipitate Sir2 from Δhmt1, Δrpd3, and Δhmt1/Δrpd3 cells. Primer sets are the same as in Fig. 3. Bars represent the experimental signal normalized to the GAL1 ORF. Error bars represent standard deviation of three biological samples (n = 3) per genotype, and asterisks denote p-value of 0.05 by Student’s t-Test.
