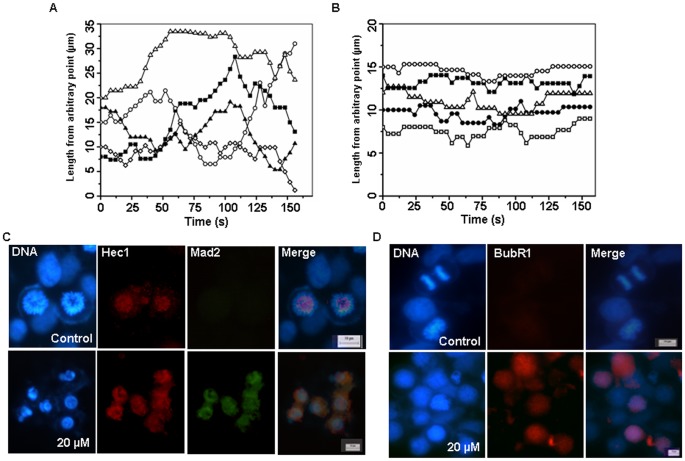
Figure 5. BCFMT-treatment dampened dynamics of individual microtubules and accumulated spindle assembly checkpoint proteins at the kinetochores in MCF-7 cells.
(A & B) Life history traces shows microtubule length changes with time in the absence (A) and presence of 10 µM BCFMT (B). The initial length represents a length from an arbitrary fixed point of a microtubule to the plus end of the microtubule. (C & D) BCFMT treatment accumulated checkpoint proteins Mad2 (green) (C) and BubR1 (red) (D) at the kinetochores. The position of kinetochores was visualized using antibody against Hec1 (red) (C). DNA stained in blue. Scale bar is 10 µm.

