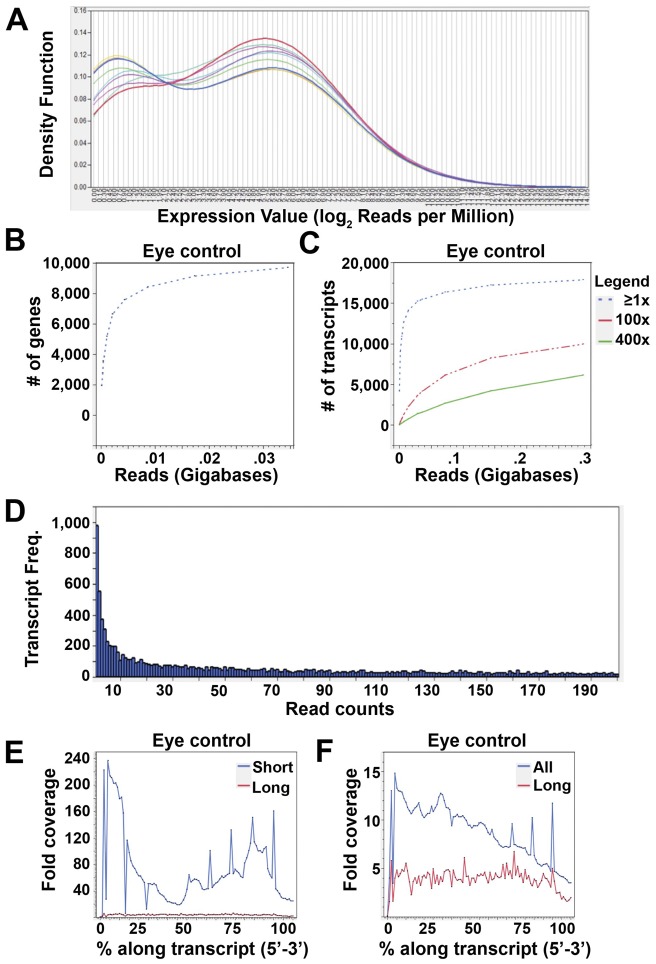
Figure 2. Illumina mRNAseq data are of high quality.
(A) Overlaid one-way kernel density distribution curves for the 9 mRNAseq libraries generated, showing strong similarity among the libraries. (B,C) Graphs of the number of genes detected as a function of the amount of sequence data generated for the eye control library for both genome (B) and transcriptome (C) aligned reads, demonstrating the depth of sequence data. (D) Histogram showing number of transcripts plotted versus the number of reads representing each transcript for the eye control library, demonstrating that a large percentage of genes are represented by at least 2 reads. (E,F) Histogram showing read coverage, averaged across all transcripts with aligned reads, calculated at 1% intervals along the 5′ to 3′ extent of each transcript, showing little bias in coverage. “Short” transcripts are ≤500 bp; “long” transcripts are ≥10,000 bp.

