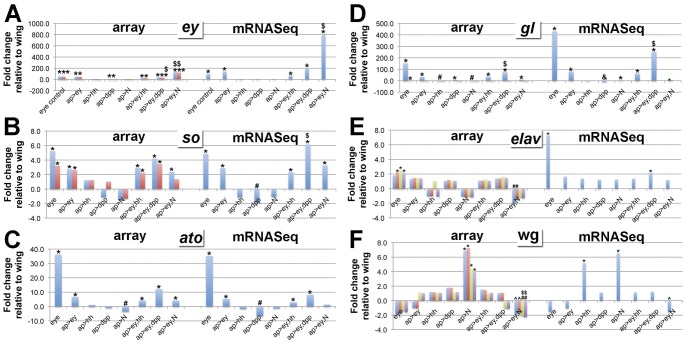
Figure 4. Eye genes are upregulated when Ey+signaling factors are misexpressed in the wing disc.
Graphs show fold change values for array and for mRNAseq for genes associated with eye development or with wing development for different libraries relative to the wing control. Array data: values are averages for all 4 replicates; different probes present on the arrays are shown in different colors; “*” and “#” indicate statistically significant upregulation or downregulation, respectively; “$” indicates statistically signficant upregulation in ap>ey+signaling factor versus both ap>ey and ap>signaling factor; “?” indicates statistically significant upregulation in ap>ey+signaling factor versus either ap>ey or ap>signaling factor; in all cases statistical significance was determined by SAM analysis. mRNASeq data: based on genome-aligned unique reads; “*” and “#” indicate fold changes versus wing that is greater than 1.7X or less than −2.5X , respectively, as determined in Figure 4; “$” indicates fold change greater than 1.7X in ap>ey+signaling factor versus both ap>ey and ap>signaling factor; “?” indicates fold change greater than 1.7 in ap>ey+signaling factor versus either ap>ey or ap>signaling factor; “&” indicates 0 reads aligned to a particular gene, with fold changes determined using 0.5 to avoid division by 0.

