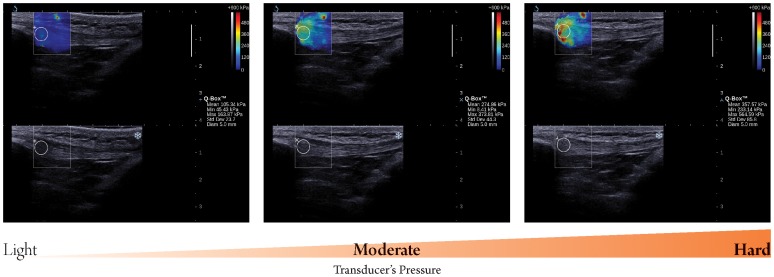
Figure 2. Longitudinal sonograms of patella tendon (PT) taken with different transducer’s pressure.
Upper images show color-coded box presentations of PT elasticity (stiffer areas were coded in red and softer areas in blue) superimposed on longitudinal grey scale sonograms of PT, with the circle representing the region of interest and its corresponding elastic modulus demonstrating under Q-Box™ on the right. Bottom images show longitudinal grey scale sonograms of PT on the identical scan planes. Transducer’ pressure changed gradually from light to hard. The transducer was kept motionless for 8 to 12 seconds during the acquisition of the SWUE sonogram and ROI of 4 mm diameter was used.

