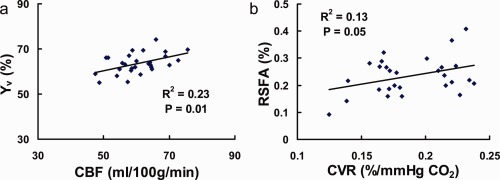
Figure 4.

Relationship among the physiologic modulators. Each symbol in the plot represents data from one subject. The solid curves show the linear fitting of the experimental data. (a) Scatter plot between baseline venous oxygenation (Y v) and global CBF, P = 0.01. (b) Scatter plot between whole brain CVR and RSFA, P = 0.05. [Color figure can be viewed in the online issue, which is available at http://wileyonlinelibrary.com.]
