Figure 2.

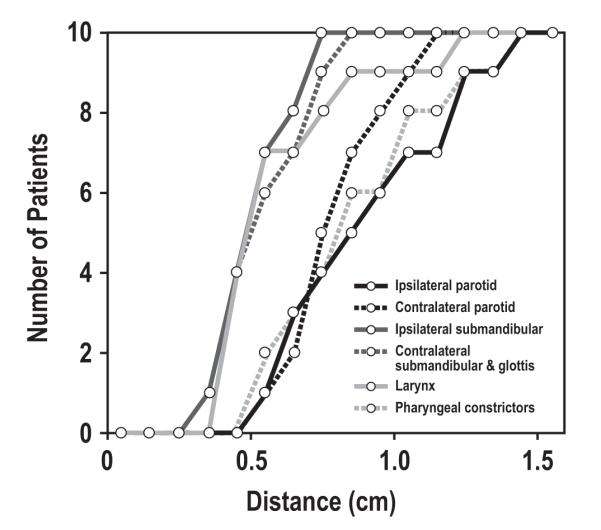
Variability in contours and relationship to dose gradients. Panels A-D: typical case with small (0.3 Gy) mean difference in OAR mean doses across optimizations. Panels E-H: case with largest dose difference (1.7 Gy).

Variability in contours and relationship to dose gradients. Panels A-D: typical case with small (0.3 Gy) mean difference in OAR mean doses across optimizations. Panels E-H: case with largest dose difference (1.7 Gy).