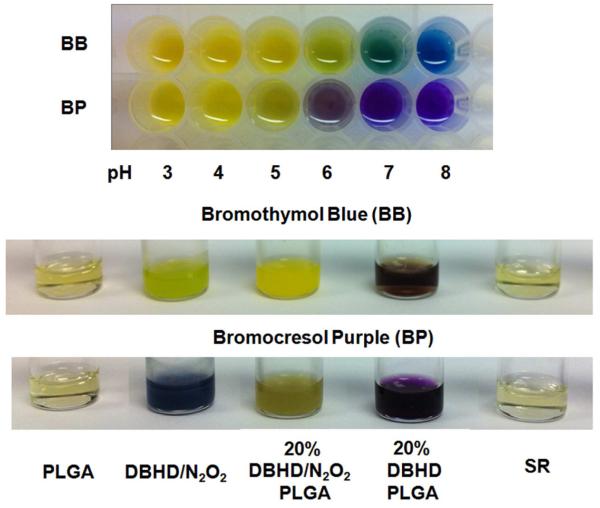
Fig. 3.
Comparison of color changes of bromothymol blue (BB) and bromocresol purple (BP) in different solutions or cocktails including pure PLGA, DBHD/N2O2, 20 wt% DBHD/N2O2 mixed in PLGA, 20 wt% DBHD in PLGA and silicone rubber THF solution (The concentration for all polymer solution is 200mg/3mL). a-50:50 lactide: glycolide PLGA is used for all the experiment. The indicator concentration is 10 mmol kg−1. The colors of the solutions were compared rightly after the solutions were prepared. The color chart below indicates the variation of indicator colors with pH in PBS buffer.

