
Figure 2.
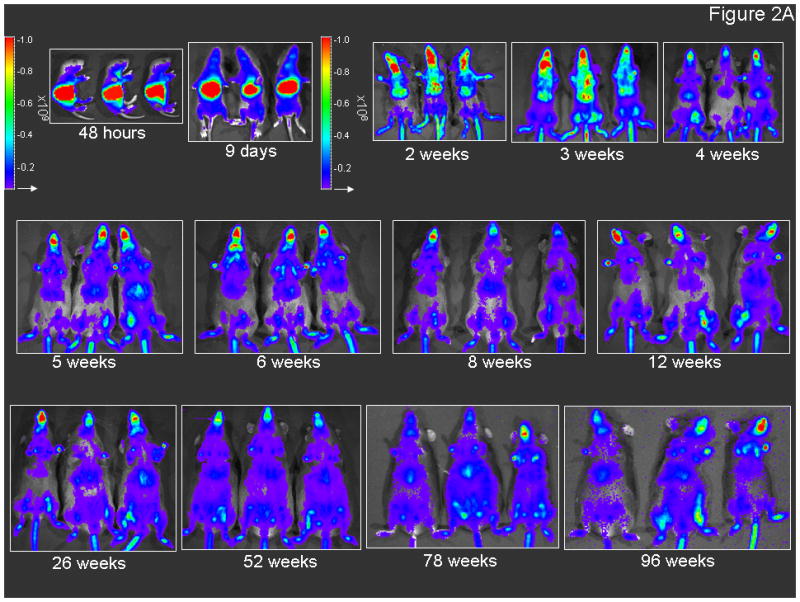
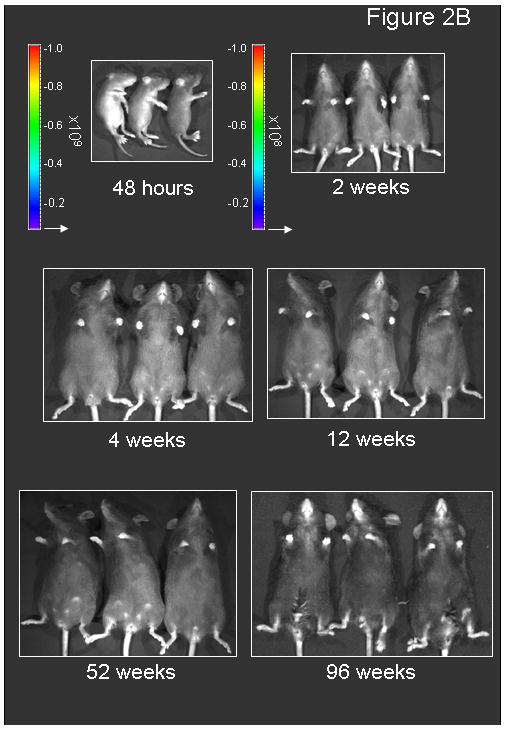
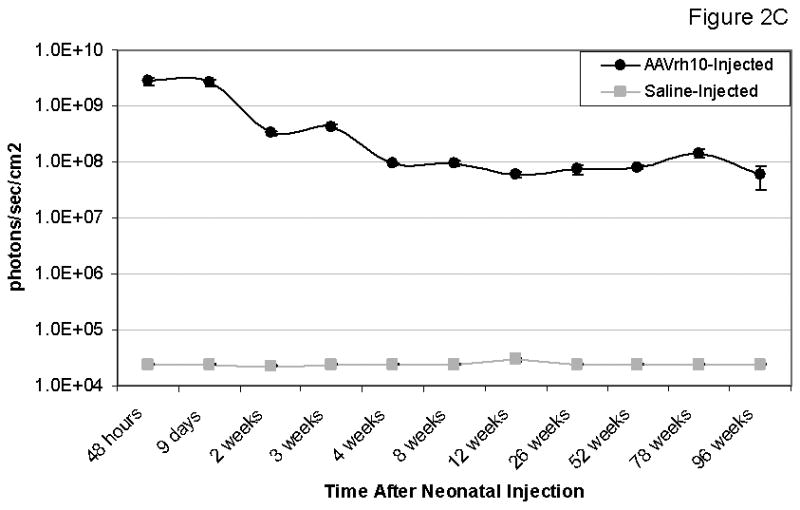
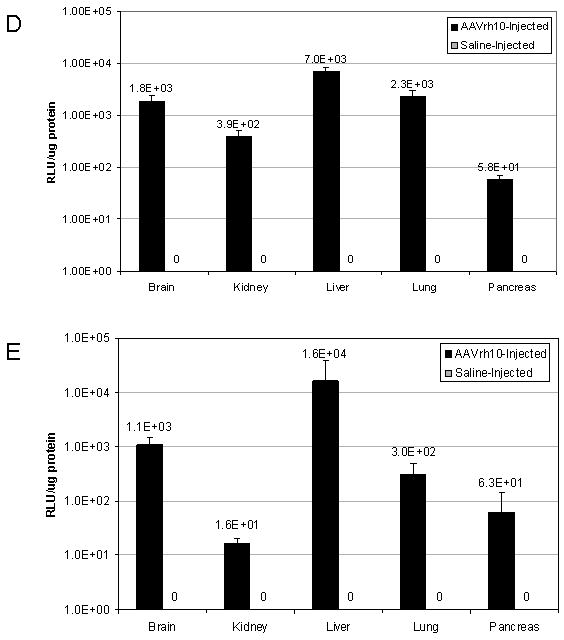
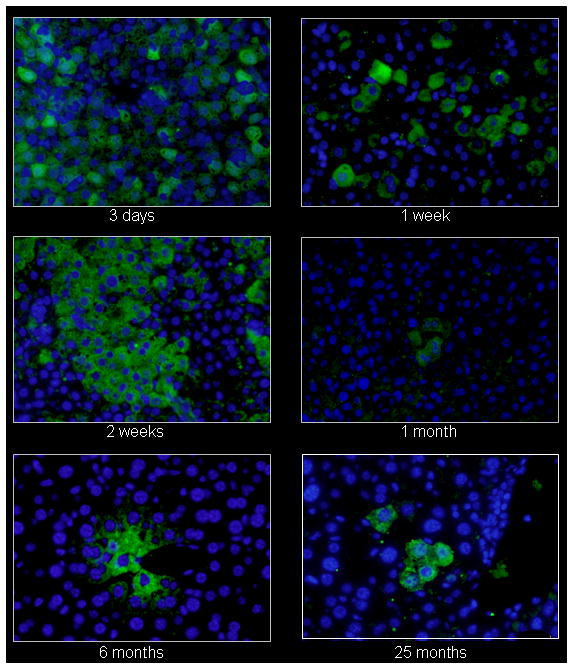
Persistence of luciferase expression after vector administration to neonatal mice. In vivo imaging of firefly luciferase after intravenous injection of A) 2.0×10¹² gc/kg of AAV or B) saline on the 2nd day of life demonstrates photon diffusion patterns. The images are shown at 2 days (48 hours after injection), 9 days, 2 weeks, 3 weeks, 4 weeks, 5 weeks, 6 weeks, 8 weeks, 12 weeks, 26 weeks, 52 weeks, 78 weeks and 96 weeks after vector administration and at 48 hours, 2 weeks, 4 weeks, 12 weeks, 52 weeks, and 96 weeks after saline administration. Total flux in photons/second was acquired. For all time points except at 48 hours, images were acquired with the mice in the ventral position. Images at 48 hours and 9 days and from 2 to 96 weeks were set with the same references such that side-by-side comparison can be made. Note changes in the legend of the pseudocolor scale per group between these two groups. C) BLI was followed longitudinally in animals as was luminometry in selected tissues at D) 1 month and E) 25 months after vector administration. F) Representative histological liver sections examined at indicated times after intravenous injection of two-day-old mice receiving 2×10¹² gc/mouse of AAVrh10-CBA-luciferase (640× magnification). (n=6-8 animals per group at each time point for A, B and C, and n=5 animals per group at for D and E.) (Error bars represent mean + SD.) (AAV=adeno-associated virus)