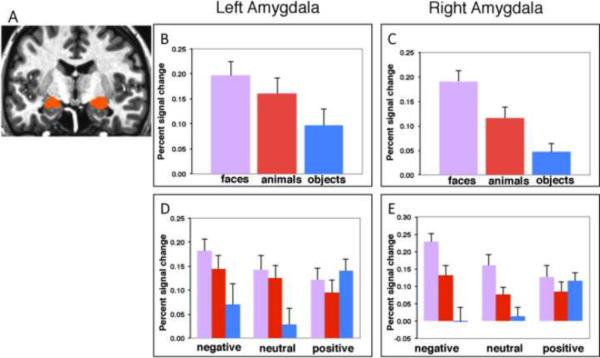
Figure 3.
(A) Group anatomical amygdala mask. (B – E) Histograms show mean (±SEM) percent signal change in the left and right amygdala in response to faces (pink), animals (red), and manipulable objects (blue) for the main effect of Category (B & C), and the Category × Affect interaction (D & E). The percent signal change to the weapons (negative objects), relative to the scrambled object baseline, = −.002. (see text for details).

