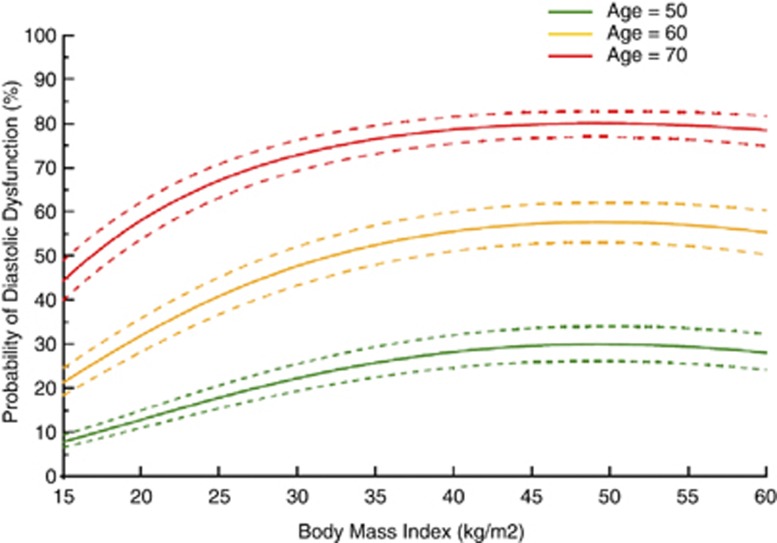
Figure 2.
Probability of DD by BMI. Utilizing the final model in Table 3, nomograms with 95% confidence intervals of the association between DD and BMI are plotted and stratified based on three hypothetical age groups. For any given age, the prevalence of DD increased with increasing BMI. For example, the probability of DD for a 50-year-old patient with normal systolic function is ≈15% if he has a normal weight, 20% if overweight, 25% if obese and 28% if morbidly obese.

