
Fig. 2.
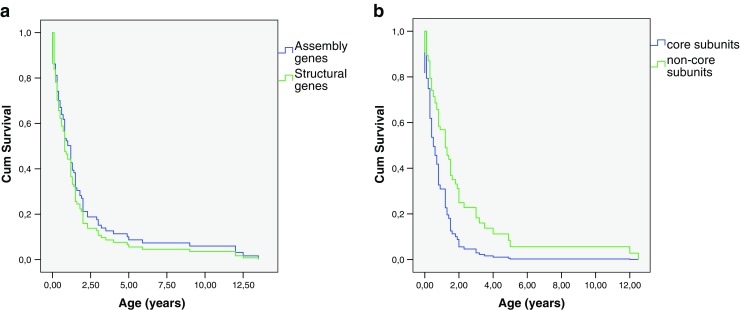
Cox regression survival curve of complex patients. Age in years (x-axis) and cumulative survival (y-axis). a Survival of patients with mutations in assembly genes (blue) compared to patients with mutations in structural genes (green) (b = -0.169; p = 0.457; n = 90). B: Survival of patients with mutations in core subunits (blue) compared to patients with mutations in non-core genes (green) (b = 0.732; p = 0.007; n = 61)