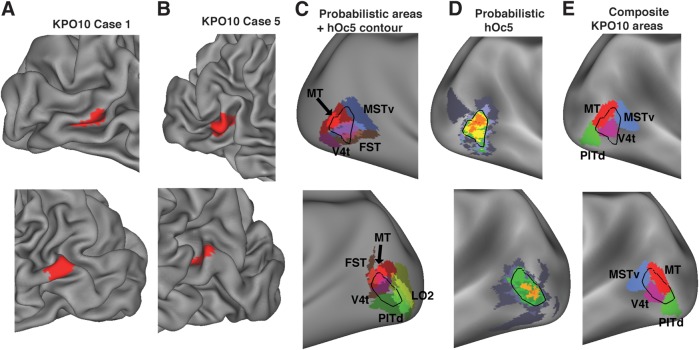
Figure 11.
(A,B) Extent of retinotopically mapped MT and its relation to architectonic hOC5, in case 1 (A) and case 5 (B) of Kolster et al. (2010). Maps are split roughly evenly between gyral and sulcal cortex in the individual hemispheres. (C) Retinotopic areas of KPO10 include area V4t (purple), MSTv (blue), FST (brown), PITd (green), and LO2 (yellow). (D) Probabilistic area hOc5 from Fischl et al. (2008) mapped to the right (top) and left (bottom) very inflated atlas surfaces. Black contours in each panel indicates the most likely boundary of hOc5 and are also shown in panels C and E. (E) Composite maps of retinotopic areas from KPO10 cases 1 and 5 shown in relation to area hOc5 boundaries.

