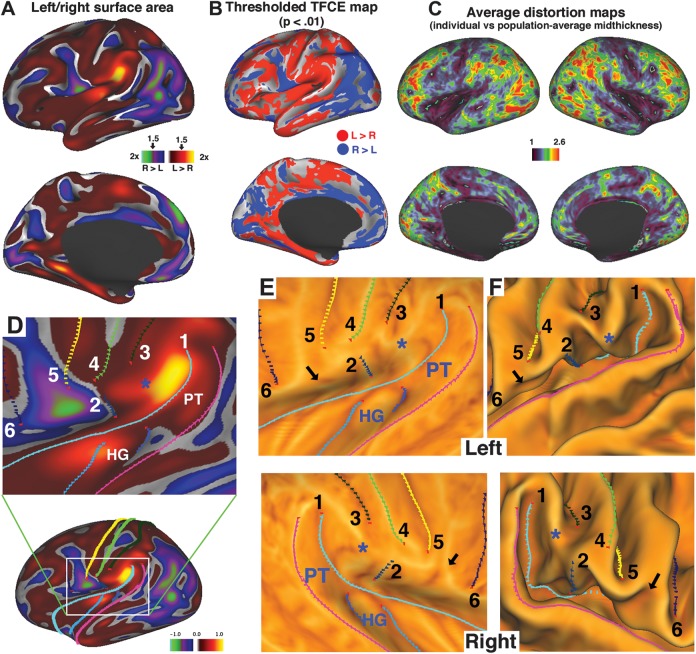
Figure 5.
(A) Surface asymmetry map based on the ratio of surface area associated with corresponding left and right hemisphere nodes (average area of all tiles containing the node) in each individual, averaged across all Conte-69 subjects and smoothed (70 iterations on the surface) to reduce noise. (B) Statistically significant asymmetries based on the TFCE method (see Materials and Methods). Hemispheric asymmetries in the Sylvian Fissure. (C) Average distortion map (ratio of individual midthickness to Conte-69 average midthickness surface area, averaged across all 69 individuals separately for the left and right hemispheres and used to compensate for surface area estimates). (D) Hemispheric areal asymmetry map displayed on an expanded view of the Conte-69 left very inflated surface along with landmarks used for registration of the left and right hemispheres to the fs_LR atlas (full hemisphere on bottom, expanded on top) To estimate the average areal asymmetry of the PT, its extent was delineated by landmark contour 1 (light blue), the posterior HG landmark (dark blue), and the superior temporal and supramarginal gyri (pink contour). (E) Landmark contours overlaid on mean curvature maps—computed on average midthickness but displayed on very inflated for the left (top) and right (bottom) perisylvian surfaces. (F) Same as E but shown on midthickness surfaces.

