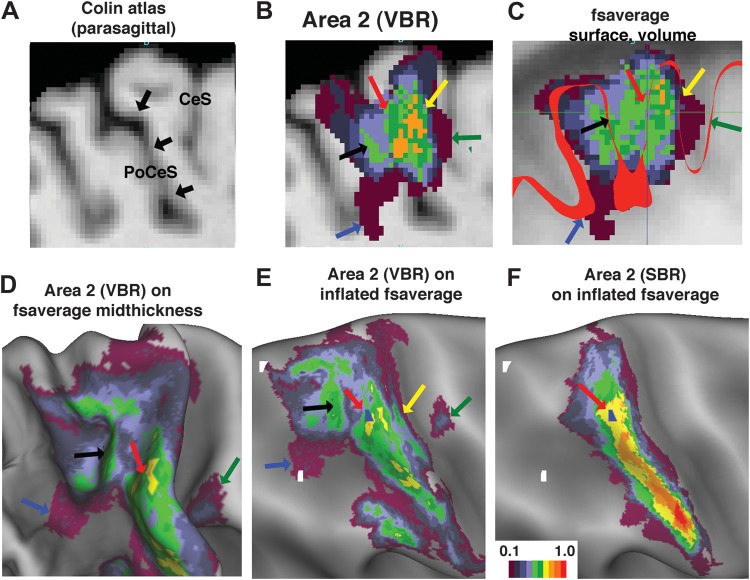
Figure 6.
VBR versus SBR of area 2. (A) Parasagittal slice through the postcentral sulcus (PoCeS) and neighboring regions of the Colin single-subject atlas volume. Arrows indicate the expected location of area 2 on the anterior bank of the PoCeS. (B) Probabilistic area 2 (VBR-based) overlaid on the same volume slice. (C) Probabilistic area 2 registered by additional VBR steps to the fsaverage volume, with the fsaverage surface contour overlaid. (D) VBR-based area 2 mapped to the fsaverage midthickness surface by volume-to-surface mapping. (E) The same map of VBR-based area 2 displayed on the inflated atlas surface. (F) Area 2 mapped to the fsaverage surface by Energy-SBR (Fischl et al. 2008) and to the fs_LR surface (see Materials and Methods). In panels E and F, white highlighted nodes were used for determining geodesic distances between the limits of area 2 mapped by VBR versus SBR.

