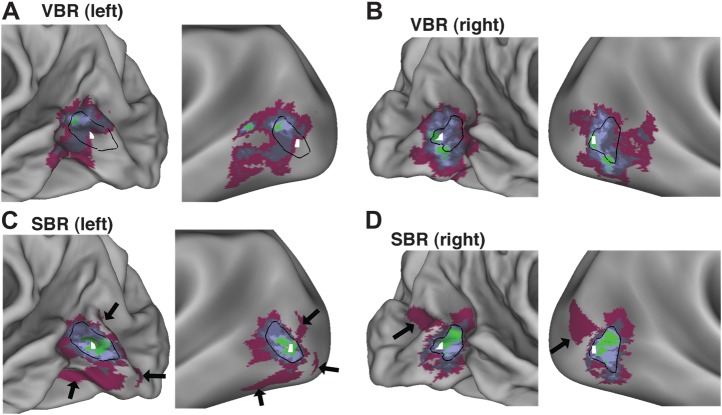
Figure 7.
VBR versus SBR of hOc5. White highlighted node is the same in all panels. (A) Probabilistic area hOc5 mapped by nonlinear VBR to the left (panel A) and right (panel B) fsaverage midthickness surface (left) and inflated surface (right). (C,D) Energy-SBR maps of hOc5 for the left and right hemispheres. In all panels, contour outlines show the composite border for hOc5 based on the energy-SBR probabilistic map for each hemisphere (panels C and D).

