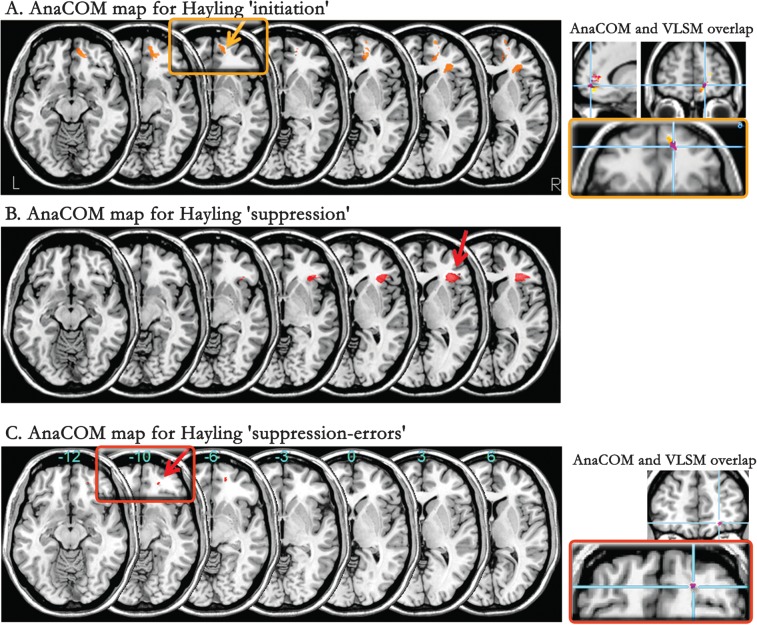
Figure 3.
AnaCOM maps. Statistical maps of the Hayling scores and subscores: (A) “initiation,” (B) “suppression,” (C) “suppression-errors,” are superimposed on serial axial sections of a normalized brain (left part of the figure). Framed regions are also emphasized on the right side of the figure, together with corresponding coronal and sagittal views. Figures on the right highlight the overlap between AnaCOM and VLSM regions (in purple) associated with a deficit on the “initiation” subscore (top right) and on the “suppression-errors” subscore (bottom right). Only significant areas at a Holm threshold are represented. Right side of the brain is on the right of each section.

