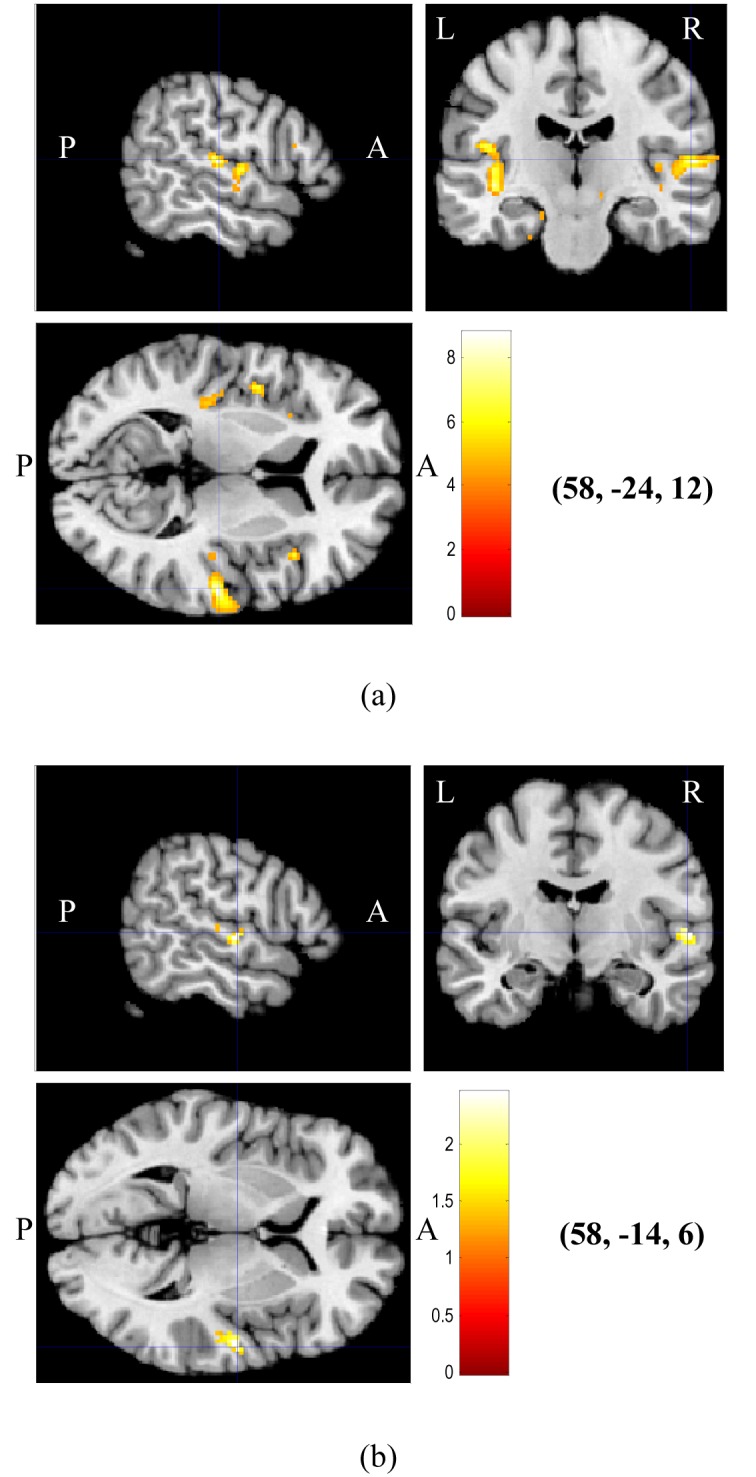
Figure 3.

Statistical parametric maps (SPMs) showing brain activation overlaid onto structural brain images, obtained from (a) RFX on all participants at uncorrected α = 0.001, and (b) conjunction analysis on all participants at uncorrected α = 0.1. The coordinates of maximum intensity indicated by the crossing hairlines are shown in brackets. Colour codes represent increasing t values from red to white (A – anterior, P – posterior, L – left hemisphere, R – right hemisphere).
