
Figure 3.
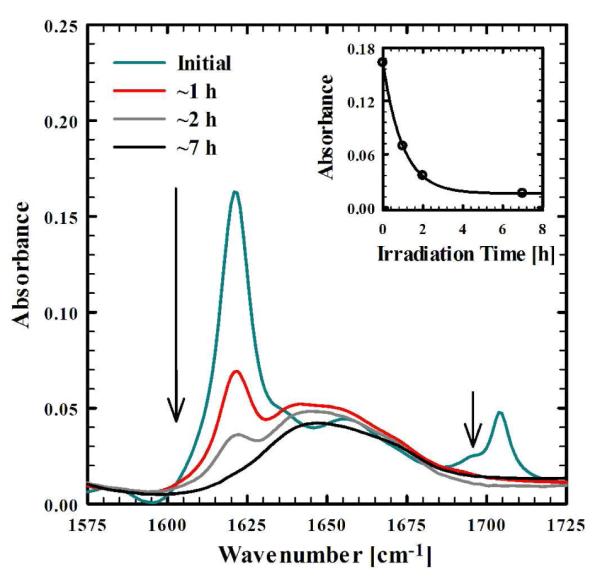
FTIR spectra (in the amide I’ region) of the F19K* aggregate solution in Figure 1, acquired at various times after irradiation with 355 nm light. The arrows depict the direction of increasing irradiation times. Also shown in the inset is the absorbance at 1620 cm−1 as a function of the irradiation time. The line is the fit of these data to a single-exponential function with a time constant of ~1 h.