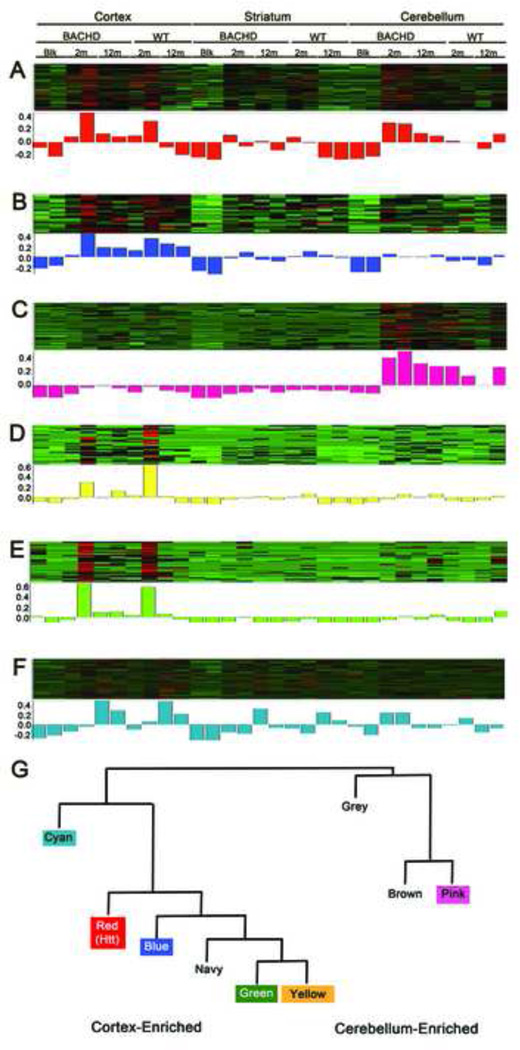
Figure 5. Enrichment of Htt interactome modules and meta-networks in specific sample conditions.
(A–F) The heat map correlation profiles (rows) across samples (columns) for proteins in the following color modules are shown: A) Red B) Blue C) Pink D) Yellow E) Green F) Cyan where green indicates areas of low correlation profiles and red indicates areas of high correlation profiles. The 30 sample conditions are indicated by brain regions, genotype (BACHD vs WT), and age (2m, 12m) or control IP lacking Htt antibody (Blank or Blk). The two duplicated conditions (two separate columns) are labeled only once. (G) Module eigenprotein meta-network reveals the cortical-enriched sub-network and the cerebellum-enriched sub-network.

