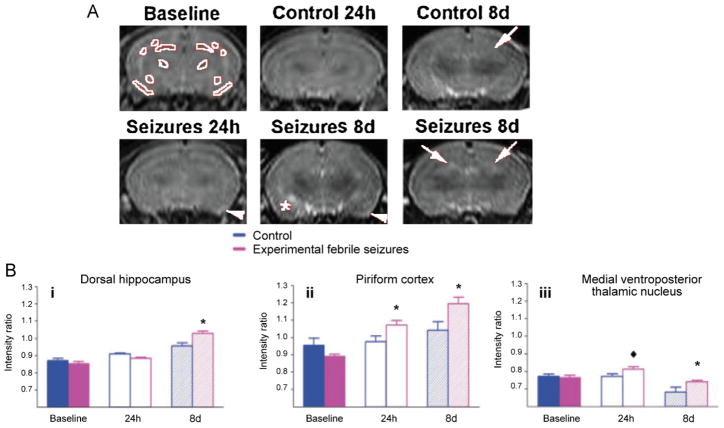
Fig. 1.
T2-weighted MRI signal intensities after prolonged experimental febrile seizures (FSs). (A) The control and the seizure animal groups were imaged before the seizures on postnatal day 10, P10, to provide baseline intensities, and on P12 (24 h after seizure, seizure group) as well as 8 days after the seizures. Regions used for analysis are delineated in white in baseline image. Increased signal intensity is evident in the dorsal hippocampus (white arrows), piriform cortex (white arrowheads), and amygdala (asterisk). (B) T2 signal intensity modulation by prolonged experimental FSs: (i) a significant increase of T2 signal occurred in dorsal hippocampus, by 8 days after the seizures, (ii) in piriform cortex, signal intensity increased significantly at 24 h and 8 days, (iii) in the medial ventroposterior thalamic nucleus, signal intensity increased significantly at 8 days and there was a strong trend for increased signal at 24 h (diamond).
This figure is reproduced from Dube et al. [30] with permission.

