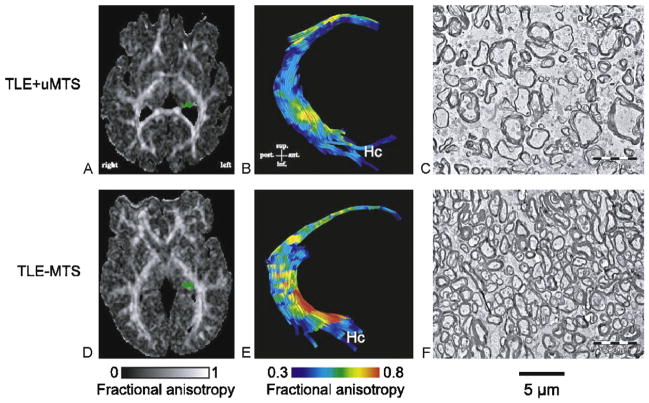
Fig. 3.
DTI tractography and electron microscopy of the fimbria-fornix. Histological fields of the fimbria-fornix resected during surgery from two patients with TLE are shown with their corresponding FA maps (A and D, with the left fimbria-fornix marked as green) and tractography of the fimbria-fornix (B and E). The patient with MTS shows lower diffusion anisotropy of the fimbria-fornix (B) than the patient without MTS (E). This corresponds to lower axonal density and higher extra-axonal fraction for the patient with MTS (C) than for the patient without MTS (F).
This figure is reproduced from Concha et al. [26] with permission.

