
Figure 2.
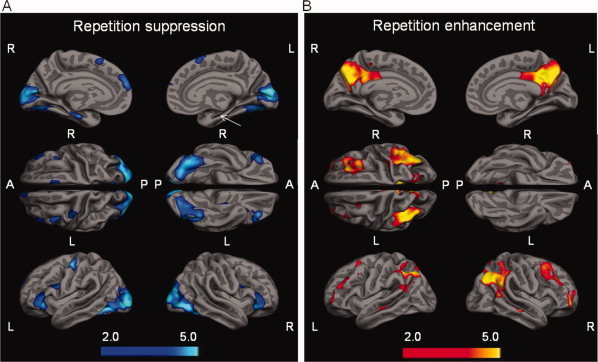
Repetition suppression and repetition enhancement during successful repetitive encoding. A: Displays areas with significantly increased activation in the first encoding trial as compared to the last encoding trial (SPM2, one‐sample t‐test using RHITenc1 > RHITen3, p FDR = 0.05). Right = R, Left = L, Anterior = A, Posterior = P. Lighter colors indicate more significant activation (light blue/dark blue). Arrow depicts cluster of activation in the left hippocampus/parahippocampal gyrus. B: Displays areas with significantly decreased (less) deactivation in the last encoding trial as compared to the first encoding trial (SPM2, one‐sample t‐test using RHITen3 > RHITenc1, p FDR = 0.05). Lighter colors indicate more significant activation (yellow/red).