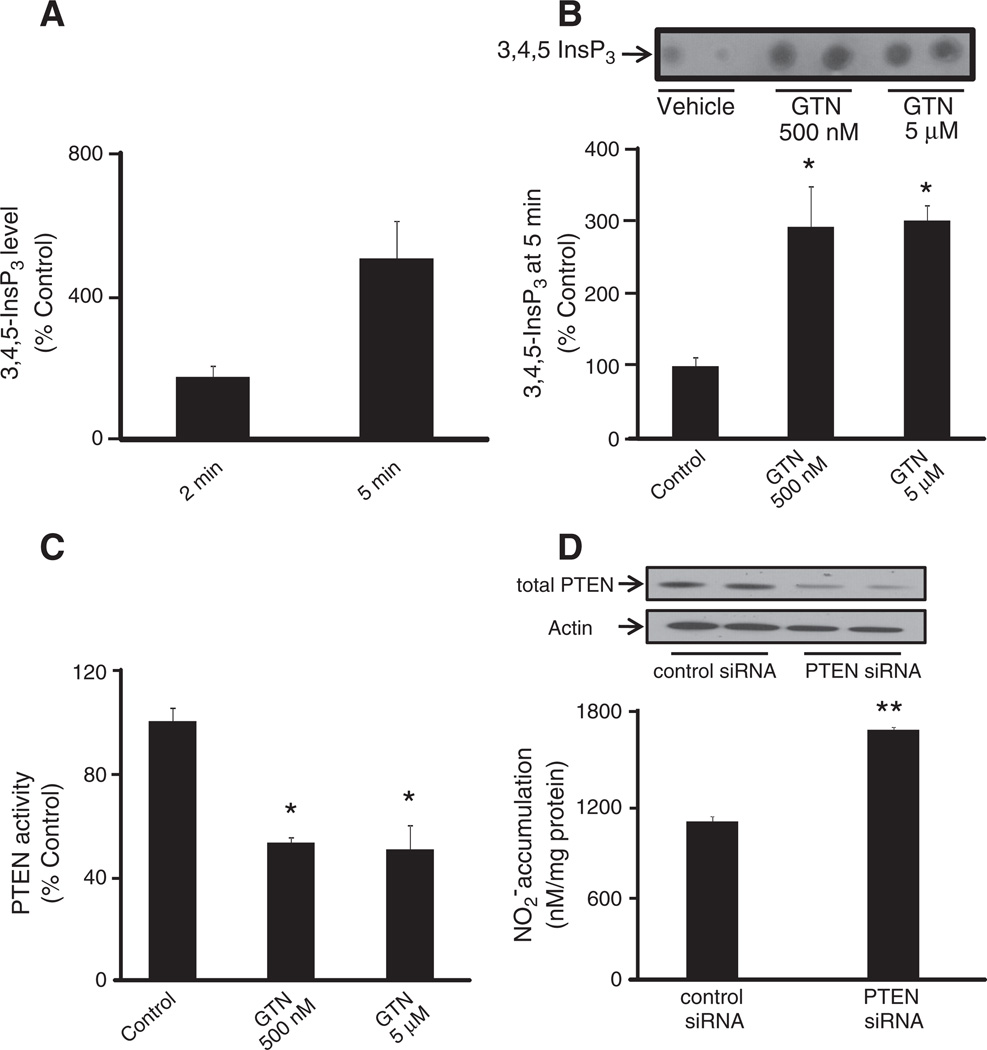
Fig. 7.
GTN treatment elaborates cellular 3,4,5-InsP3 level by inhibiting PTEN activity. (A) Measurement of 3,4,5-InsP3 level as a time-dependent response to GTN treatment. HMEC were treated with 500 nM GTN for 2 and 5 min. Results are shown relative to control. (B) Mass strip blot of PTEN substrate 3,4,5-InsP3 in HMEC treated with vehicle or GTN for 15 min. Results are shown relative to control. (C) Measurement of immunoprecipitated PTEN phosphatase activity by Biomol green assay. Three independent experiments were performed and the results reveal PTEN inhibition consistent with increase in 3,4,5-InsP3 levels. The values are reported as phosphate release relative to control; *P<0.05 by Student's t test. (D) PTEN silencing by siRNA in MEC and subsequent measurement of basal NO production was assessed by the chemiluminescence-based quantification of accumulation in medium. Results show mean values of four independent measurements; **P<0.01. Quantification of band densities was performed using Image software.

