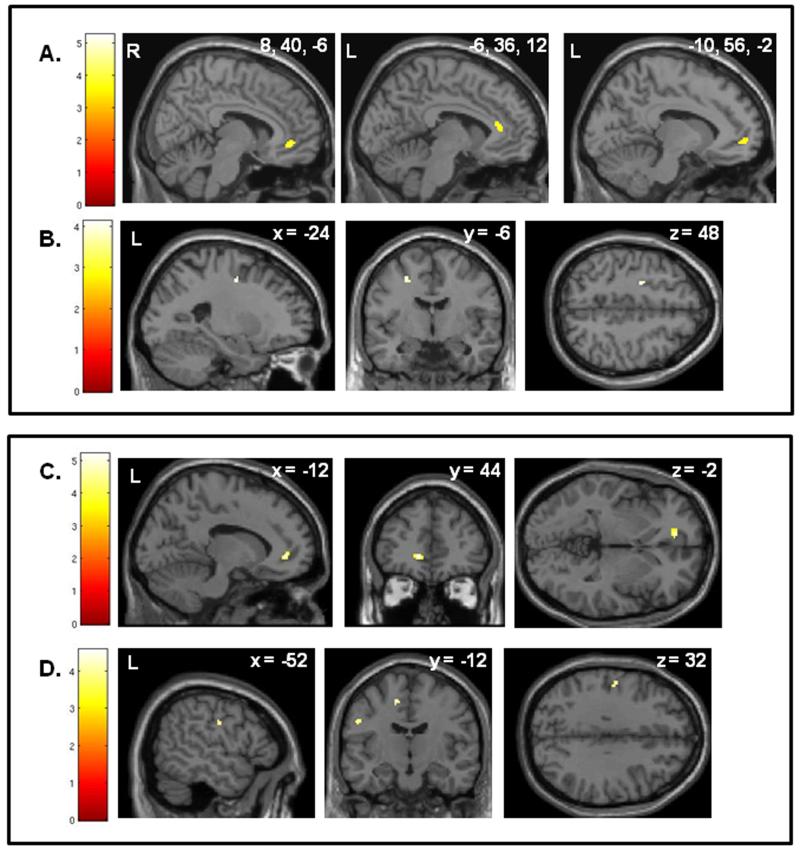
Figure 3.
Regions showing a significant interaction between Group (Schizophrenia/Healthy Control) and the relationship between Theory of Mind (ToM) and gray matter volume (GMV). The top panel (A & B) shows results for the performance-based ToM measure, The Recognition of Faux Pas Test, and the bottom panel (C & D) shows results for the self-reported ToM measure, IRI Perspective-Taking. Results for the Faux Pas task: A. Regions where the correlation between Faux Pas Score and GMV is stronger for schizophrenia (SZ) participants than healthy control (HC) participants. The results show that Faux Pas scores are more strongly related to VMPFC GMV (three separate clusters) among SZ participants than among HC participants. MNI x, y, z coordinates for the three separate clusters are: 8, 40, −6; −6, 36, 12; and −10, 56, −2. B. Regions where the correlation between Faux Pas Score and GMV is stronger for HC participants than SZ participants. The correlation between Faux Pas Scores and middle frontal sulcus GMV was stronger for HC than SZ participants. Results for IRI Perspective-Taking: C. Regions where the correlation between IRI Perspective-Taking score and GMV is stronger for schizophrenia (SZ) participants than healthy control (HC) participants. The results show that IRI Perspective-Taking scores are more strongly related to VMPFC GMV among SZ participants than among HC participants. D. Regions where the correlation between IRI Perspective-Taking score and GMV is stronger for HC participants than SZ participants. The correlation between IRI Perspective-Taking scores and postcentral gyrus GMV and was stronger for HC than SZ participants. Data shown at p<.001.

