
Figure 2.
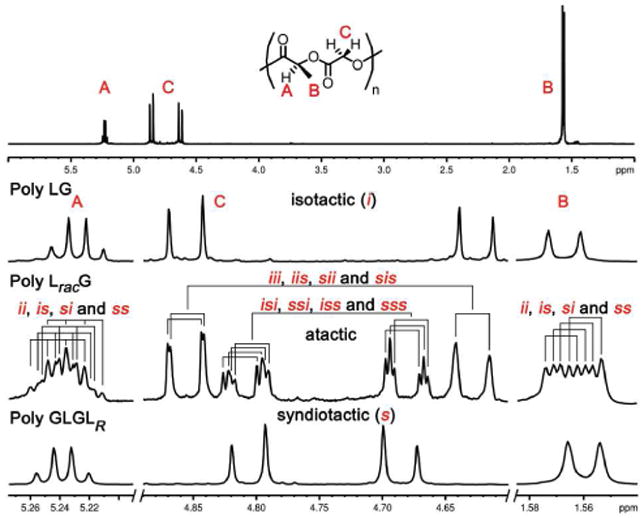
(Top) Full spectrum of poly LG; (Bottom) expansions of selected regions for poly LG, LracG and GLGLR. 1H NMR spectra at 600 MHz in CDCl3.
Official websites use .gov
A
.gov website belongs to an official
government organization in the United States.
Secure .gov websites use HTTPS
A lock (
) or https:// means you've safely
connected to the .gov website. Share sensitive
information only on official, secure websites.
(Top) Full spectrum of poly LG; (Bottom) expansions of selected regions for poly LG, LracG and GLGLR. 1H NMR spectra at 600 MHz in CDCl3.