Figure 2.

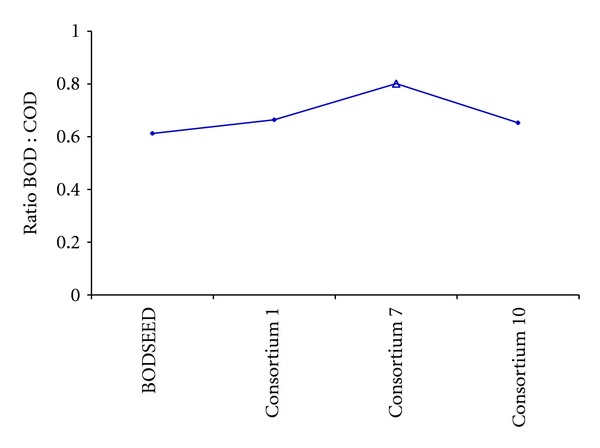
Comparison of BOD : COD ratios of dairy industrial wastewater sample (n = 3) using 3 selected bacterial consortia. Data shown with symbol Δ represent the best performing consortia.

Comparison of BOD : COD ratios of dairy industrial wastewater sample (n = 3) using 3 selected bacterial consortia. Data shown with symbol Δ represent the best performing consortia.