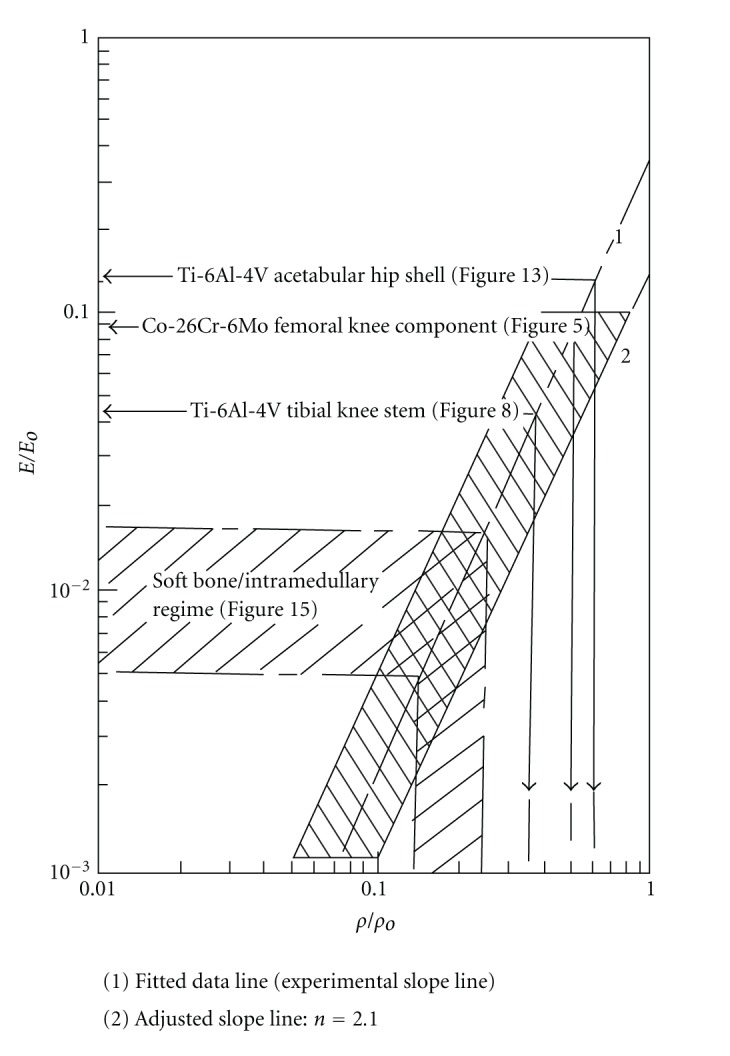
Figure 6.

Stiffness-density design plot composed of experimental data [6]. The data field for Ti-6Al-4V and Co-29Cr-6Mo is shown shaded. The shaded regime follows a fitted slope, n = 2.1. Examples for prototype designs discussed in the text are noted.
