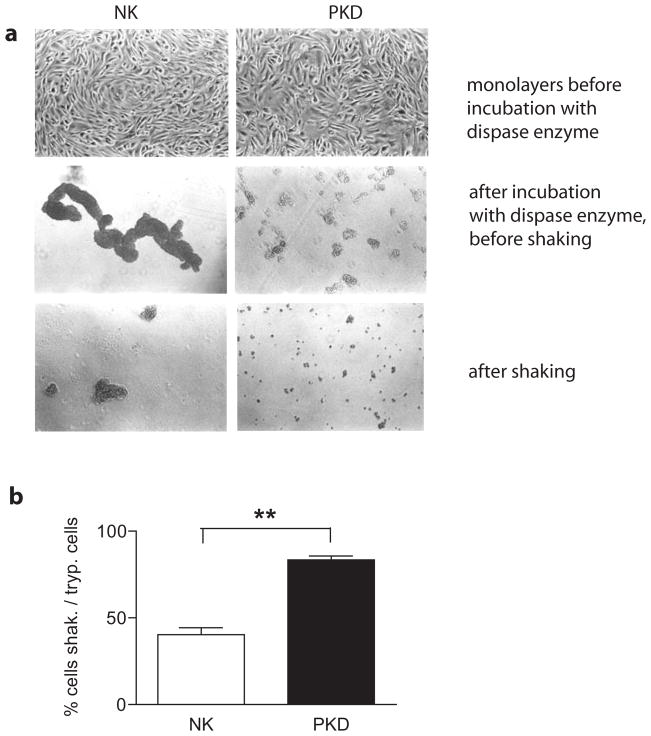
Figure 4. Desmosomal mediated cell-cell adhesion is compromised in ADPKD cells.
NK and PKD cell monolayers were incubated with dispase, released from the substrate and briefly shaken for a fixed time.
a. Cells were imaged with a Zeiss, inverted light microscope. Top panels show NK and PKD cells forming confluent monolayers (10X objective). Middle panels show normal kidney cells in large, interconnected sheets (NK cells), while ADPKD cells are in small aggregates (PKD) after incubation with dispase enzyme, but before shaking. Bottom panels show the same samples after shaking, where the difference is further exacerbated.
b. Quantification of cells released after shaking was performed using a Beckman Coulter counter. Plotted are the percentages of single or doublet cells after shaking as a function of the total number of cells assayed by trypsinization. 83.4 ± 2.20 % of PKD cells (black) were present as single or doublet cells after shaking, while only 40.3 ± 3.95 % of NK cells (white) were present as single or doublet cells after the same procedure. P= 0.005.

