
Figure 1.
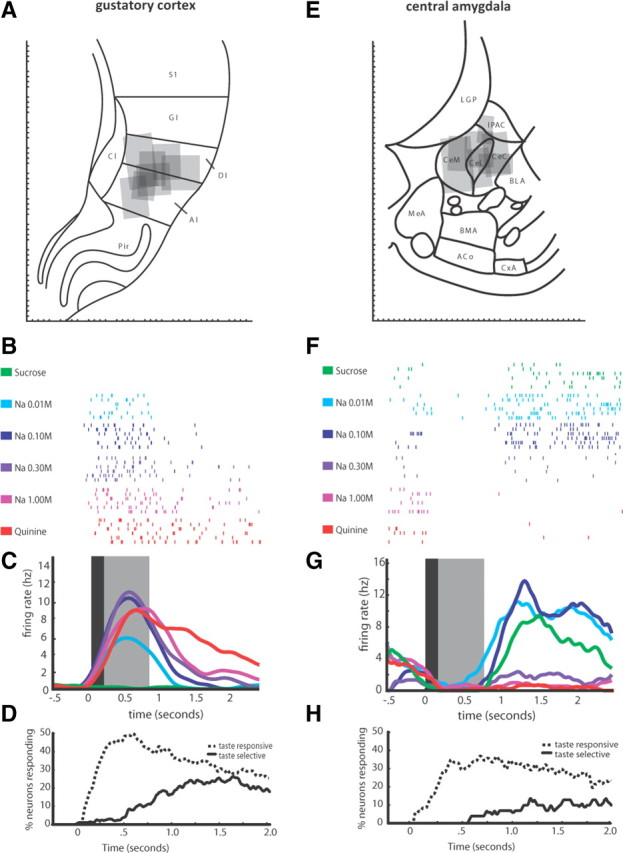
Recording taste-related responses in GC and CeA. A, Schematic representation of a coronal slice of rat brain (reprinted, in part, with permission from Paxinos and Watson, 1998) centered on GC with recording sites (gray boxes) reconstructed using electrolytic lesions marking the last recording in each animal. The angle of the box sides indicates the orientation of the implant, reconstructed from implant tracks. DI, Dysgranular insular; AI, agranular insular; S1, primary somatosensory cortex; GI, granular insular; Cl, claustrum; Pir, piriform cortex. B, Strongly taste-specific evoked spike trains from a single GC neuron following the delivery of multiple trials of the six tastes—each row is a single trial, and each hash mark is an action potential. C, Averaged PSTH of the evoked spike trains in B, smoothed with a Gaussian kernel; black shaded box denotes period of nonspecific activity in GC as noted previously (Katz et al., 2001), gray shaded box denotes period of putative GC chemosensory responsiveness, again as suggested previously (Katz et al., 2001). D, The percentage of GC neurons (y-axis) in which taste responses significantly differ from baseline firing rises at a short latency following taste delivery (dashed line); however, taste specificity (significant differences among the responses to different tastes) emerges ∼200 ms poststimulus (solid line). E, Schematic representation of a coronal slice centered on CeA [divided into central (CeC), lateral (CeL), and medial (CeM) subdivisions] with reconstructed recording sites marked as per A. BLA, Basolateral amygdala; IPAC, interstitial nucleus of the posterior limb of the anterior commissure; MeA, medial amygdala; BMA, basomedial amygdala; ACo, anterior cortical amygdaloid nucleus; CxA, Cortex-amygdala transition F, Taste-specific evoked spike trains from a single CeA neuron simultaneously recorded with the GC neuron shown in B. The same rows in B and F represent the same taste trial. G, Averaged PSTH of the evoked spike trains in F and smoothed with a Gaussian kernel; black and gray boxes as in C. H, The percentage of CeA neurons (y-axis) in which taste responses significantly differ from baseline firing also rises at a short latency following taste delivery (dashed line); however, taste specificity (significant differences among the responses to different tastes) is delayed and emerges ∼500 ms poststimulus (solid line).