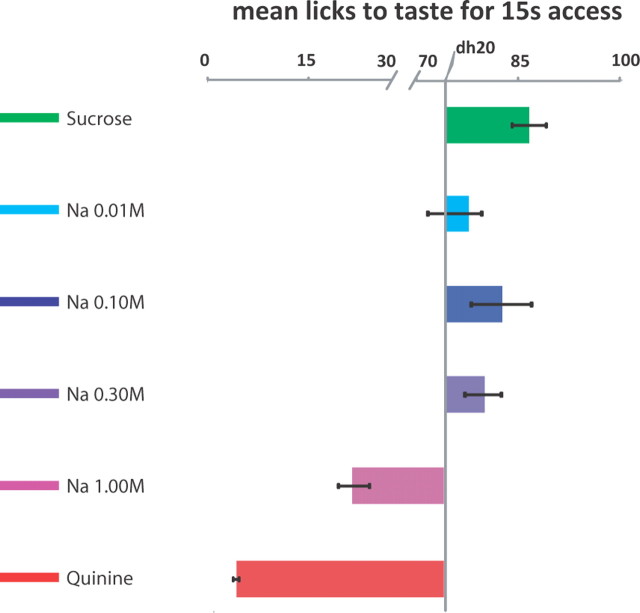
Figure 2.
Sodium palatability varies nonlinearly as a function of sodium concentration. Here, palatability is defined as the relative number of licks per 15 s of exposure, plotted as the mean number of licks to each taste (sodium, quinine, and 0.01–1.0 m NaCl) across animals (±SEM) recorded during a brief-access task, contrasted with the mean number of licks for brief presentations of distilled water. Solutions for which bars extend to the right were preferred over water, while those for which bars extend to the left were less preferable than water.

