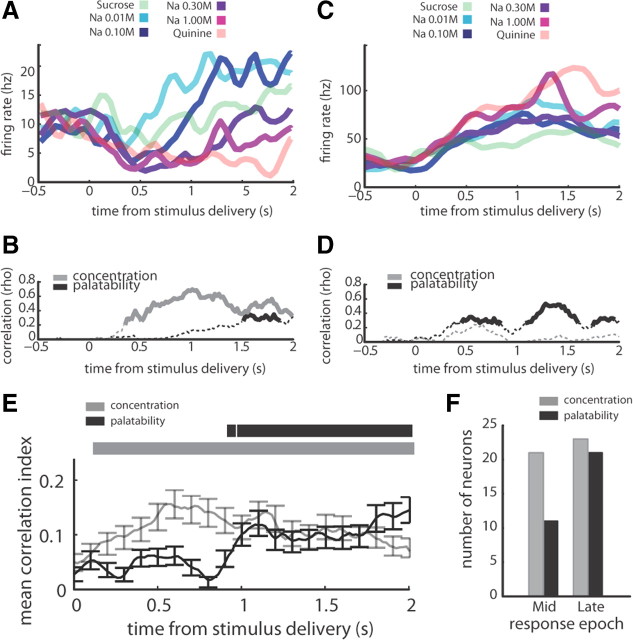
Figure 3.
Single GC neurons reflect sodium concentration and sodium palatability in distinct response epochs. A, PSTHs for an individual neuron, which produced significant responses (i.e., firing rates that differed from baseline) to 0.01, 0.1, and 1.0 m NaCl, for which the overall NaCl response pattern appeared to reflect sodium concentration. B, The magnitudes of correlation between the responses of the neuron in A and sodium concentration (gray line) or sodium palatability (black line). The solid sections of each line mark bins in which that correlation achieved significance (p < 0.05). C, PSTHs for an individual neuron, which produced significant responses to 0.01, 0.1, 0.3, and 1.0 m NaCl, for which the overall NaCl response pattern appeared to reflect sodium palatability D, The magnitudes of correlation between the responses of the neuron in C and sodium concentration (gray line) or sodium palatability (black line). The solid sections of each line mark bins in which that correlation achieved significance (p < 0.05). E, The mean correlation (±SEM) between neural response and either sodium concentration (gray line) or sodium palatability (black line), averaged across all neurons with significant correlations with concentration or palatability; correlation with concentration rose above initial correlation (p < 0.05; significant bins marked by gray horizontal bar) at 120 ms poststimulus, while correlation with palatability rose at a delay, achieving a significant increase (p < 0.05; significant bins marked by black horizontal bar) 940 ms poststimulus. F, the numbers of GC neurons that produced responses significantly (p < 0.05) correlated with concentration (gray) and palatability (black) in the Middle and Late epochs, underlying the effect see in E.

