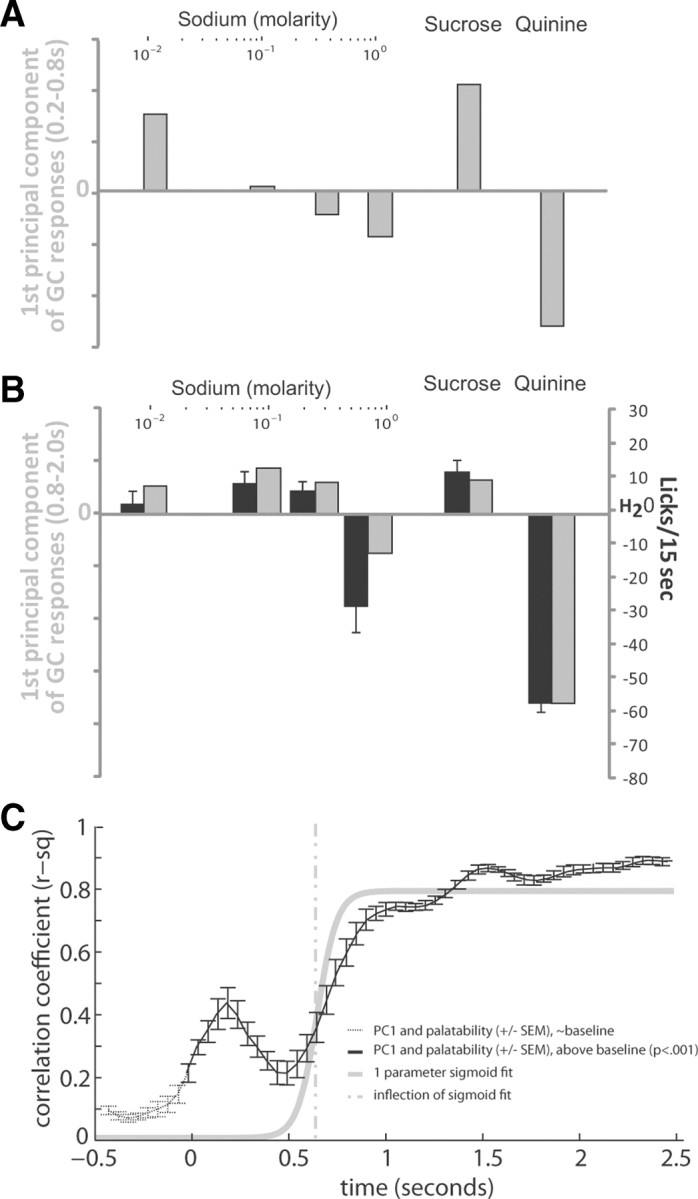
Figure 4.

The entire GC population reflects taste concentration and taste palatability sequentially. A, The first principal component of the evoked population response (gray bars) within a previously identified chemosensory processing period (Katz et al., 2001). B, The first principal component of the evoked population response (gray bars) within previously identified palatability processing period (Katz et al., 2001; Grossman et al., 2008) is presented along with preference behavior (black bars, reprinted from Fig. 2). C, The correlation (mean ± SEM) of PC1 of the population response (200 ms evoked response window of an 80% bootstrapped sample of GC neurons) with preference behavior through time holding at low levels, prestimulus (black dotted line) and rising significantly twice following stimulus delivery (black solid line). A one parameter sigmoid fit to the correlation between population response and palatability (gray solid line) models this rise in correlation, with the inflection point of the sigmoid fit (gray dotted line) marking the onset of palatability in the population response.
