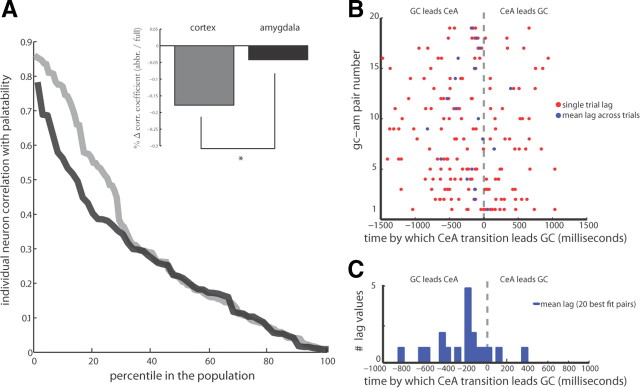
Figure 7.
CeA neurons do not code palatability in the same manner as GC neurons, and do so at a delay. A, Individual GC (gray) and CeA (black) neurons have a strong correlation with the full palatability function during the late response epoch, but stronger correlations were observed in GC on a neuron-to-neuron basis. Inset, In estimating the percentage change from a full palatability function to a truncated good-or-bad response function, the strongest palatability correlating GC neurons (gray) showed a significant decrease in correlation with the abbreviated palatability curve while the strongest palatability correlating CeA neurons (black) showed no difference in correlation between the two functions. B, The differences between late firing-rate transitions in simultaneously recorded pairs of GC and CeA neurons, both for individual trials (red circles) and averaged across all trials (blue circles) for the 20 pairs best fit by the transition detection model. C, A histogram tabulated from the average transition lags between GC–CeA pairs plotted in B (blue line); the modal lag is a 200 ms delay, with GC leading the CeA.

