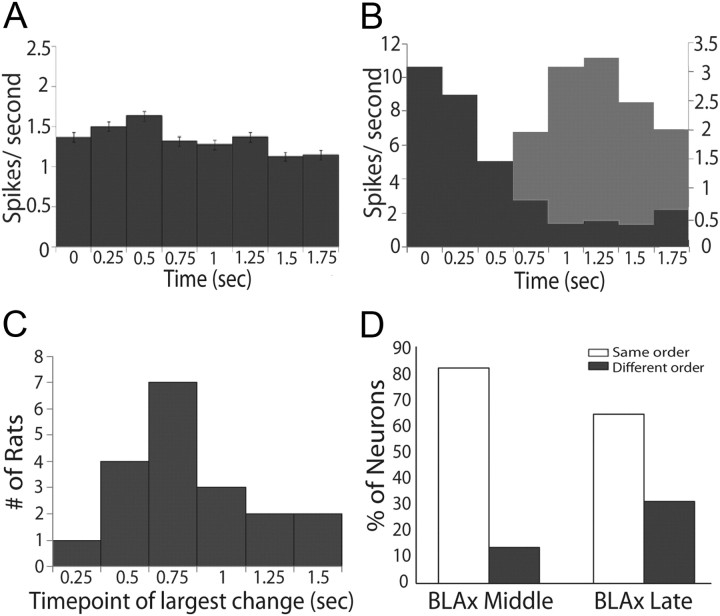
Figure 6.
Epoch dependency of the effects of BLAx. A, Absolute differences in firing rates (spikes/s, y-axis) between Intact and BLAx sessions for the entire sample (n = 145) of GC neurons across time in seconds (x-axis), divided into 250 ms bins. B, Similar histograms for representative ensembles from two animals demonstrating time-structure that is lost in the overall average; for one ensemble (dark gray), BLAx-induced changes measured in terms of absolute differences in firing rates were high early and lower late; for the other example (light gray), the pattern was reversed. The x- and y-axes are the same as for A. C, The results of change point analysis brought to bear on the data for each ensemble, showing that the impact of BLAx reliably changed between 0.75 and 1 s (bins 3 and 4). y-axis, Number of ensembles for which the greatest change in impact of BLAx occurred between particular pairs of bins; x-axis, time point of the largest change in seconds. D, The percentage of neurons (y-axis) where the order of responsiveness (e.g., which tastes caused the largest, second largest, third largest, and smallest responses) was the same (open) during BLAx as BLA Intact or different (gray) in both the Middle and Late epochs (x-axis).

