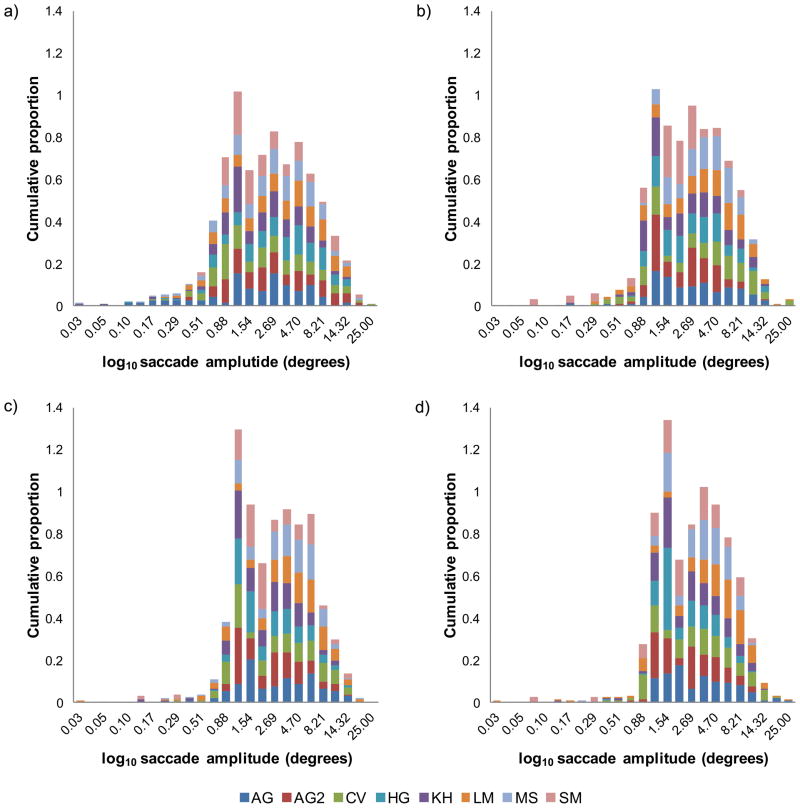
Figure 4.
Distribution of log10 mean saccade amplitudes for eight subjects, indicated by the caption. Cumulative proportion of saccade amplitudes for (a) control no scotoma condition, (b) scotoma σx,y = 1°, (c) scotoma σx,y = 2° and (d) scotoma σx,y = 4°. It is important to note that the cumulative proportions for each subject, represented by a different color, sum to unity.

