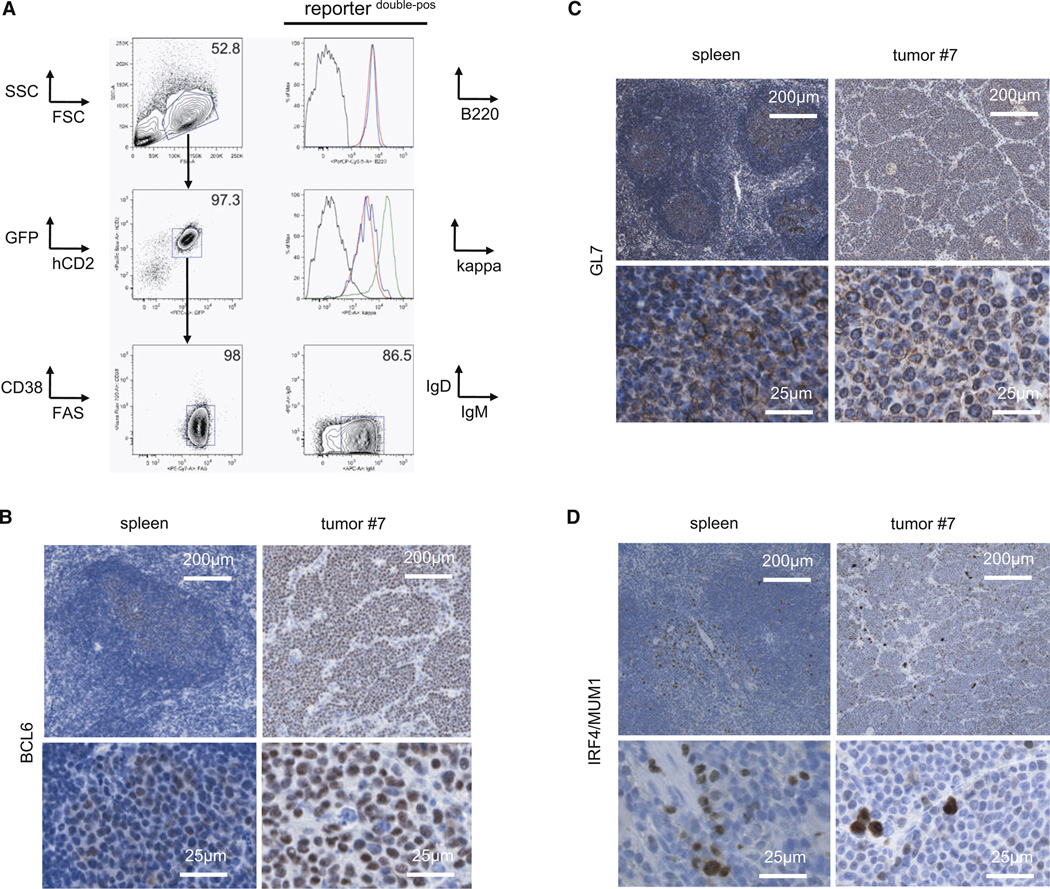
Figure 3. Lymphomas Arising upon MYC and PI3K Activation Express GC B-Cell-Specific Markers.
(A) Representative FACS analysis of GC B cell markers (B220, CD38, FAS, sIgD) and sIgM expression on tumor cells (defined as GFPpos and hCD2pos cells). The sequential gating strategy is indicated by arrows. Upper histogram: B220 expression on tumor cells (red) and normal splenic B cells (blue) in comparison to non-B cells (black). Lower histogram: Kappa light chain expression on tumor cells (red) and normal GC B cells (blue) in comparison to non-B cells (black) and normal follicular B cells (green).
(B–D) Representative immunohistochemical stainings for BCL6 (B), GL7 (C) and IRF4/MUM1 (D) in tumor no. 7 and control spleen (derived from a Cγ1-cre, R26StopFLeYFP animal 10 days after SRBC immunization). Per staining seven tumors were analyzed.
See also Figure S2.

