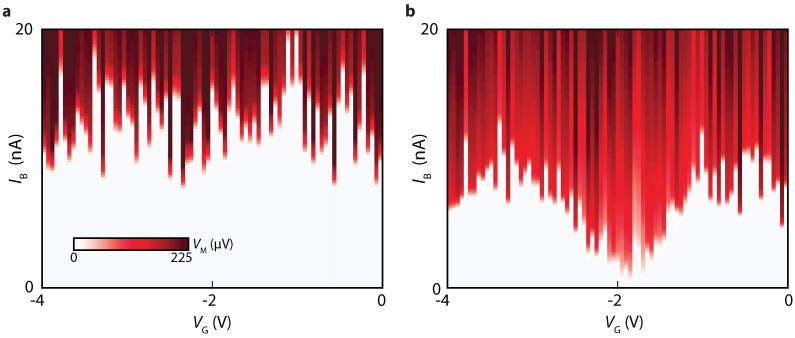
Figure 3. A gate-voltage induced magnetic flux.
(a) Colormap of VM as a function of IB and VG, taken at B = 0 T. The critical current IC is defined by the onset of a finite voltage state, indicated by the red regions. The Fabry-Perot modulation of the critical current (Fig. 2b) is visible as rapid fluctuations in IC due to the large steps in VG. The measurement is performed fast enough such that the magnetic field creep (Fig. 2c) can be neglected. (b) Same measurement taken at B = 250 mT. An additional approximately sinusoidal modulation of the critical current is seen with a gate periodicity of ΔVG = 2.5 V.

