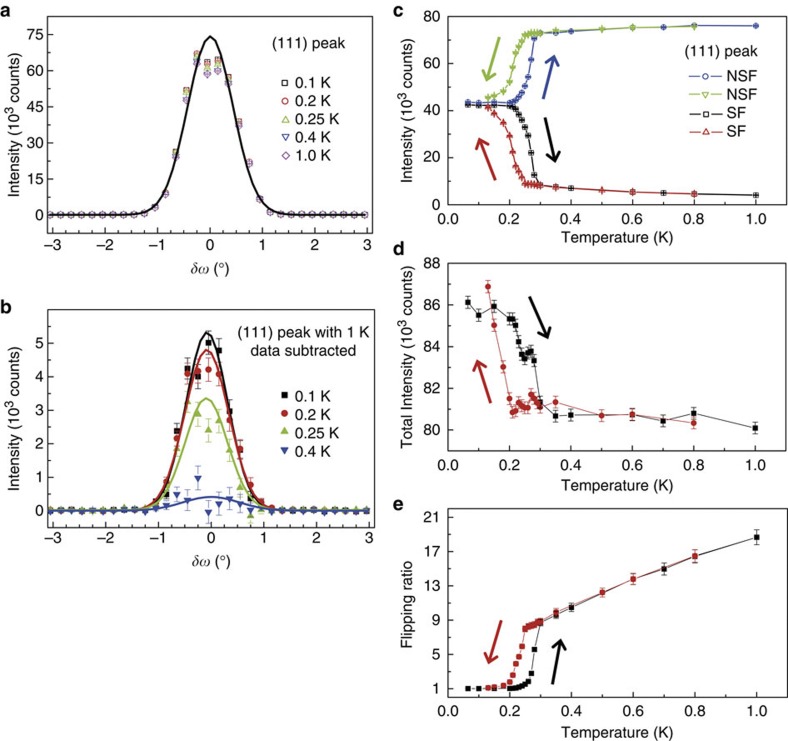
Figure 3. Hysteresis in the Bragg peak intensity and flipping ratio at (111).
The data were collected on cooling and warming across TC in the X-direction polarized neutron scattering experiments. To ensure that the system was in thermal equilibrium, measurements well below TC were performed after waiting longer than the magnetic relaxation time, which is of the order of 2 h at 0.03 K (ref. 24). (a) The rocking-curve scans of the (111) Bragg peak for the sum of the SF and NSF channels measured while warming the sample. The horizontal axis represents the deviation of the wavevector from (111) with their amplitude being unchanged. The lines are a guide to the eye. All the peaks are instrument resolution limited. (b) The magnetic contribution to the (111) Bragg peak is obtained by subtracting the data measured at 1 K, which is well above TC, in the warming sequence. (c) The growth of the integrated intensity for the (111) Bragg peak begins abruptly below TC with a discernible hysteresis in both the SF and the NSF channels. (d) The sum of the SF and the NSF (111) Bragg peak intensities versus temperature showing a hysteresis with temperature. The sum increases by almost 6% below TC in agreement with the previous measurements24. (e) The flipping ratio of the neutron spins at the (111) Bragg peak as a function of temperature. This ratio falls off steeply to unity below TC with a clear hysteresis. The data were collected by first warming and then cooling. This sequence is indicated by the arrows in (c–e).

