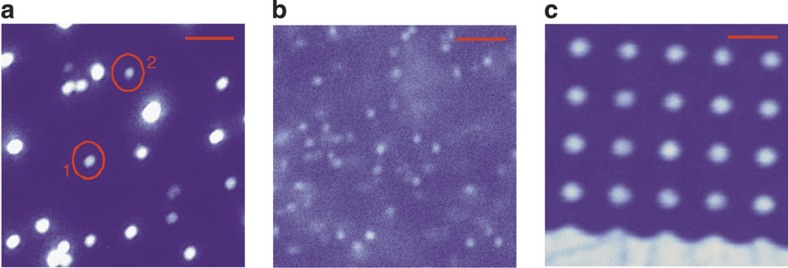
Figure 2. Upconversion scanning microscopy images of Pr3+:YAG.
(a) Ultraviolet fluorescence image of YAG nanoparticles dispersed on a glass slide. Within the 10×10 μm2 scan two marked spots are showing single emitter antibunching. (b) Fluorescence image of high purity YAG crystal. Bright spots are attributed to individual Pr3+ single ion impurities. (c) Ultraviolet fluorescence image of nominally pure YAG single crystal implanted with Pr3+ ions. The implantation mask contained holes arranged in a square grid. Scale bars in all three panels correspond to 2 μm.

