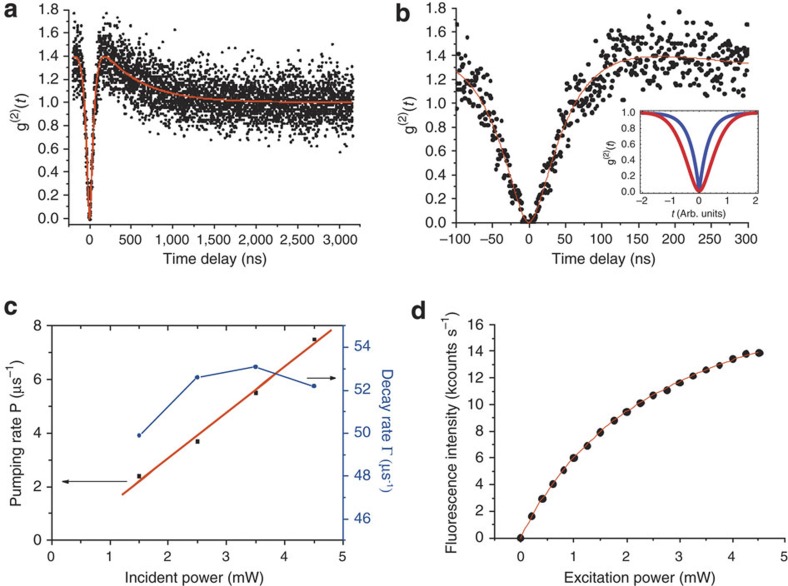
Figure 3. Excited-state dynamics of a single Pr3+ ion.
(a) Normalized g(2) function measured at spot 1 on Fig. 2a with 4.5 mW of excitation at 488.2 nm wavelength. The signal is fitted with the solution of the rate equations according to the four-level model shown in Fig. 1e (red line). (b) Zoom into zero-delay region of the antibunching curve. Flat bottom corresponding to quadratic temporal dependence is clearly seen. The inset compares the theoretical antibunching shapes of the emissions originating from one-step (blue, casp-like) and two-step (red, parabolic at the bottom) excitations. (c) Power dependences of the pumping rate P (black squares) and radiative decay Γ (blue circles) extracted from the fits of antibunching signals taken at 1.5, 2.5, 3.5 and 4.5 mW are shown. Taking the focused laser spot diameter to be ≈300 nm (the size of the nanoparticle seen by our microscope) and specified 85% transmission of the objective lens in the range 480–490 nm, the derived pumping rate gives the ground- and excited-state absorption cross-sections to be 7×10⁻¹⁹ cm2. This value agrees well with ground-state absorption cross-section of 6×10⁻¹⁹ cm2 deduced from the data reported previously33 and with excited-state absorption cross-section of 8×10⁻¹⁹ cm2 (ref. 23) for 532 nm wavelength. (d) Saturation behaviour of ultraviolet fluorescence at spot 1. Saturation power is 2.75 mW, whereas saturated fluorescence count rate is 22.5 kcounts s−1.

