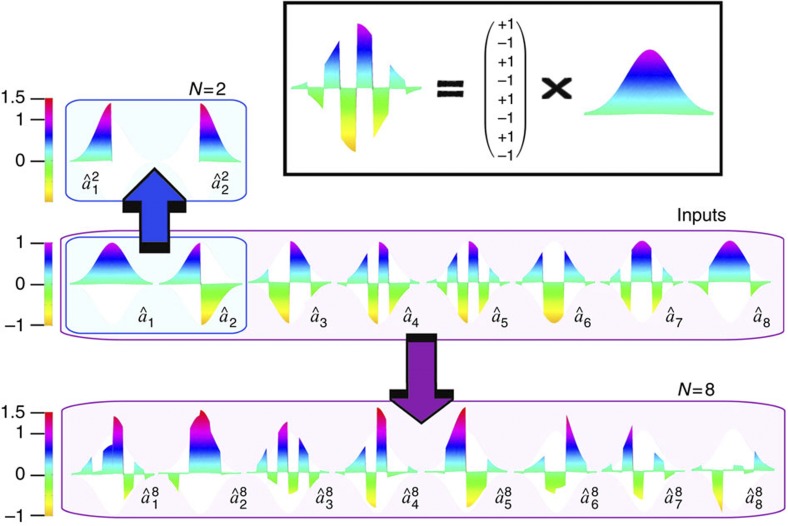
Figure 2. Spatial mode patterns.
Measured modes are defined by spatial patterns of electric field amplitudes. Shown in the top right box is an example of how the spatial mode pattern for â5 is matched by applying eight electronic gain values (G5) to the detected Gaussian profile (î). The basis of input modes  is shown in the middle row (see Methods). The arrows represent a mapping via the virtual networks
  (blue) and
  (violet) onto the respective bases of entangled modes; the top row shows the symmetric EPR or 2-mode basis, while the bottom row shows the 8-mode basis. Superscripts denote mode basis and subscripts denote mode number. The spatial mode bases for N=3 to N=7 are not shown for brevity.

