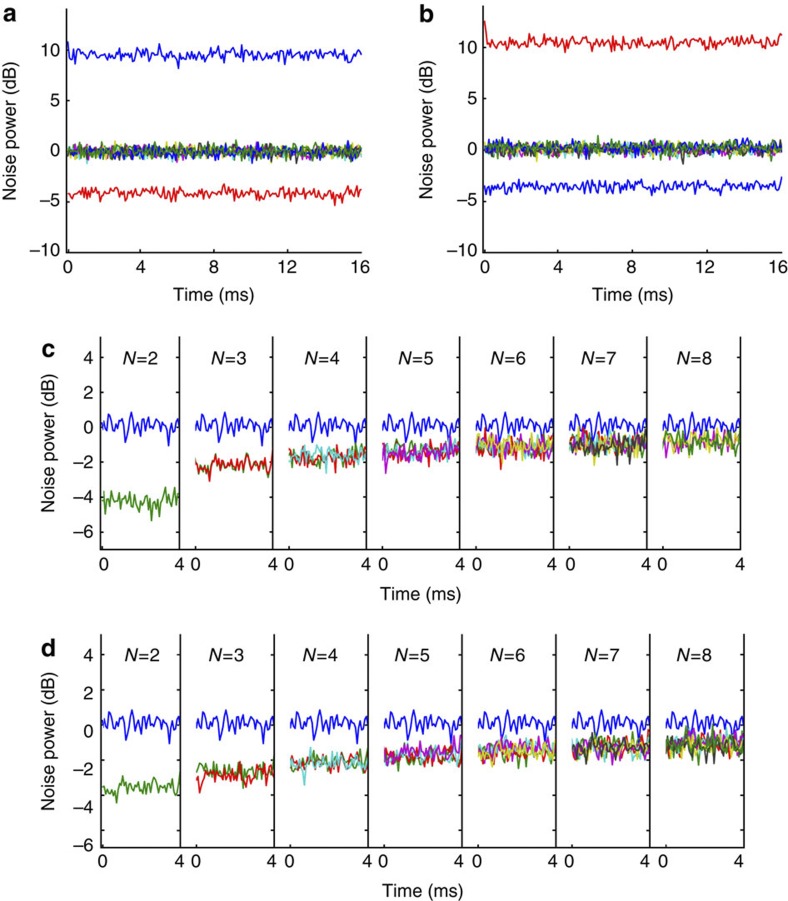
Figure 4. Noise variance measurements of the spatial modes.
(a) x quadrature measurements of the input mode basis. The squeezed 〈[Δx1]2〉 is shown in red and antisqueezed 〈[Δx2]2〉 is shown in blue. The x quadrature variances of the six vacua modes are measured to equal quantum noise (shown by the six coloured traces at 0 dB). (b) p quadrature measurements. The antisqueezed 〈[Δp1]2〉 is shown in red and squeezed 〈[Δp2]2〉 is shown in blue. The p quadrature variances of the six modes are again measured to equal quantum noise, confirming they are vacua (shown by the six coloured traces at 0 dB). (c) These variances show the x quadrature correlations between modes as in the first half of the left hand side of equation (4). Every column shows N−1 traces of x quadrature correlations below shot noise, as well as the blue shot noise trace (0 dB) normalized to two units of vacua. Each green trace shows  for each N-mode basis. Each new colour represents the other N−1 variance correlation traces of equation (4). (d) Correlations between measured modes in p quadrature, second half of the left hand side of equation (4). Each green trace now shows
  . The traces overlapping show that each pair of modes is entangled with the same strength as any other pair of modes, a result of optimizing for symmetry in the virtual networks.

