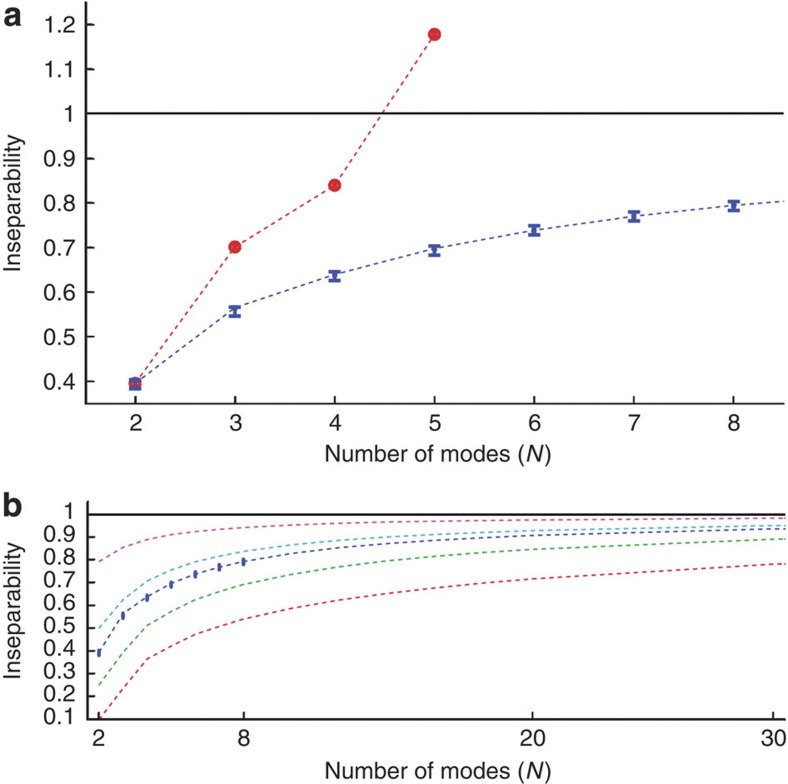
Figure 5. Inseparability for different entangled mode bases.
The solid black line represents the bound of separability. Dashed lines represent theory. All uncertainties for experimental values are ±0.01. (a) The blue markers are the averaged measured experimental values for N-mode inseparability (right column of Table 1), and the dashed blue line joins the theoretical values of inseparability with the same two squeezed inputs used in the experiment. All experimental losses have been taken into account. The red circles are the measured experimental values for N-mode cluster states with theory indicated again by the dashed red line. Here the maximum value of each row in Table 2 is shown rather than the average value, in order to show that cluster states have a much more stringent requirement on squeezing levels (N=5 is clearly separable and not a cluster state). (b) All traces have two squeezed inputs and N−2 vacua modes, as in the experiment. What changes is the amount of squeezing in the two squeezed inputs, assumed here to be symmetric with equal antisqueezing. From the top we have: −1 dB (magenta); −3 dB (cyan); experimental parameters (blue); experimental values (blue markers); −6 dB (green); and −10 dB (red).

