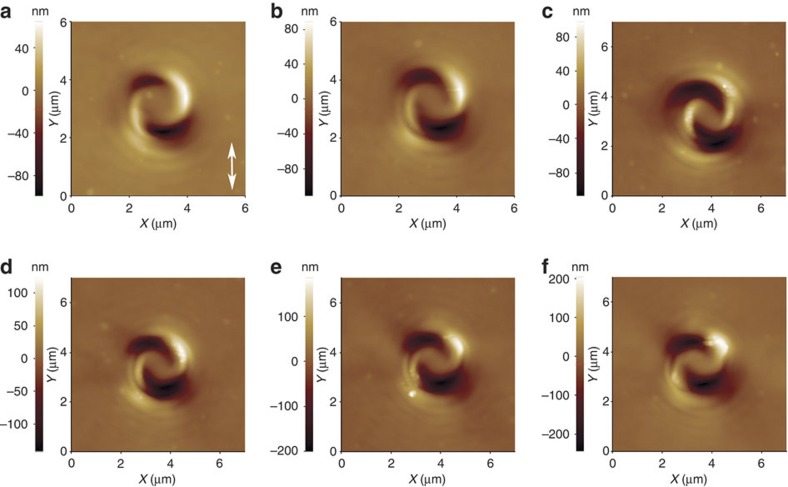
Figure 5. Spiral relief patterns obtained for different illumination doses.
AFM images of the topographical structures obtained for varying illumination intensity and fixed time of exposure (and polarization direction), for topological charge q=10. The white arrow indicates the polarization direction. Different panels correspond to different values of the laser power injected in the microscope: (a) 15 μW; (b) 18 μW; (c) 21 μW; (d) 29 μW; (e) 41 μW; (f) 54 μW. Similar results are obtained for varying time of exposure at fixed intensity.

