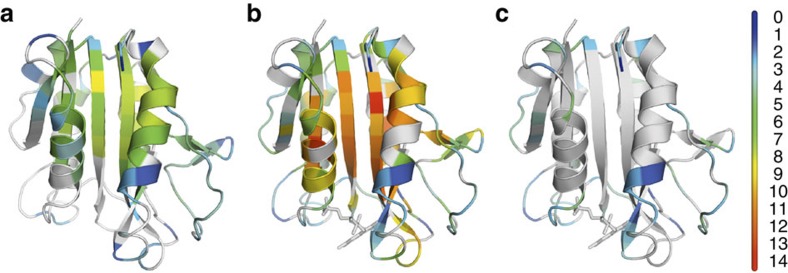
Figure 6. Thermodynamic stabilities of apoflavodoxin and flavodoxin.
The cartoon models show ΔGop at the residue level of (a) apoflavodoxin and of (b) flavodoxin, as determined by H/D exchange at pD 6.3, 25 °C. Residues are colour-coded according to the scale bar shown, with ΔGop-values in kcal mol−1. Residues for which ΔGop-values could not be determined are shown in grey. (c) Same as (b), but showing only those residues of flavodoxin for which ΔGop is smaller than 5 kcal mol−1. The cartoon models are generated with PyMOL (Schrödinger, LLC, Palo Alto, CA, USA) using the crystal structure of A. vinelandii flavodoxin (pdb ID 1YOB48), and the FMN cofactor is shown in stick representation.

