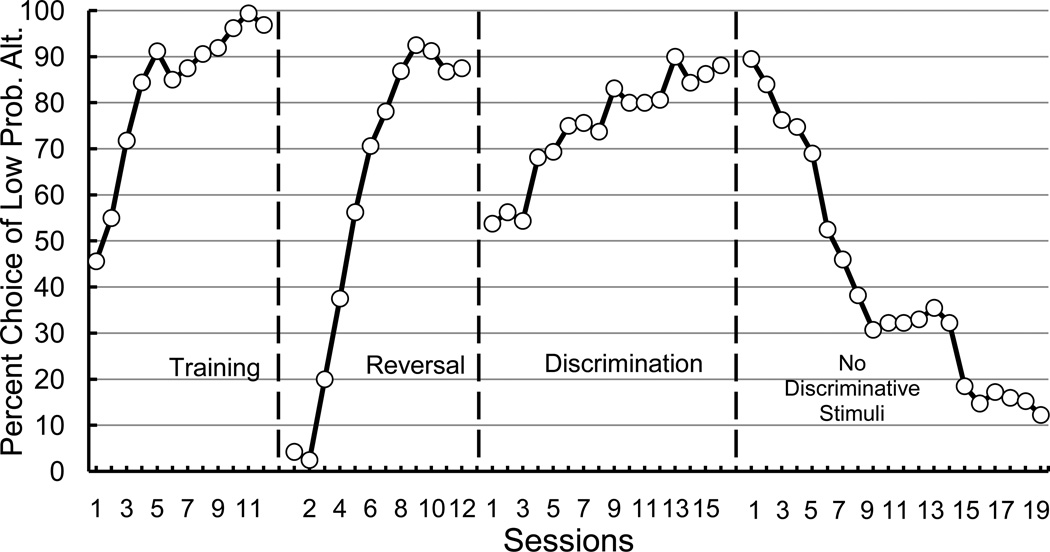
Figure 5.
Results of Stagner and Zentall (2010). Left panel: Acquisition of the preference for discriminative stimuli with a probability of 20% reinforcement over nondiscriminative stimuli with a probability of 50% reinforcement. Middle left panel: Acquisition of the preference for discriminative stimuli with a probability of 20% reinforcement over nondiscriminative stimuli with a probability of 50% reinforcement when the contingencies associated with the spatial choice were reversed. Middle right panel: Acquisition of the preference for discriminative stimuli with a probability of 20% reinforcement over nondiscriminative stimuli with a probability of 50% reinforcement when the alternatives were signaled with shape stimuli. Right panel: Acquisition of the preference for nondiscriminative stimuli with a probability of 50% reinforcement over nondiscriminative stimuli with a probability of 20% reinforcement.

