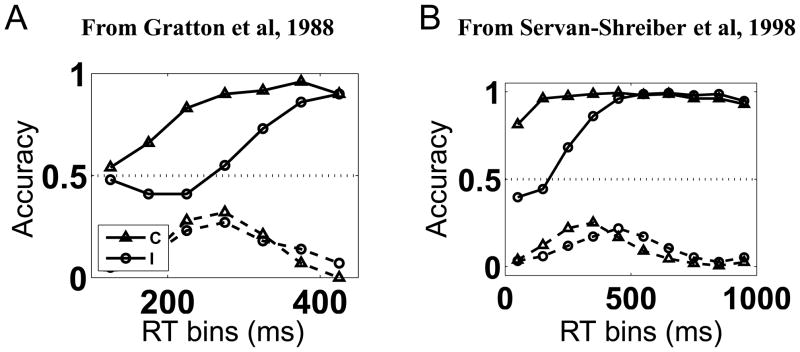
Figure 1.
Accuracy vs. RT in the Eriksen task. In both (A) and (B), the solid lines denote the empirical probabilities of making a correct response as a function of binned reaction times; the dashed lines denote the empirical distribution over RT bins. Triangle: compatible. Circle: incompatible. The dotted line denotes chance performance for comparison. (A) Data adapted from (Gratton et al, 1988); reaction times gauged by electromyographic activities (EMG). (B) Data adapted from (Servan-Schreiber, Bruno, Carter, & Cohen, 1998); RT measured by button presses. The details of the data sets differ, but several qualitative commonalities stand out: (i) incompatible trials are less accurate and slower than compatible ones, (ii) for short-RT bins on incompatible trials only, accuracy “dips” below chance before rising gradually.

