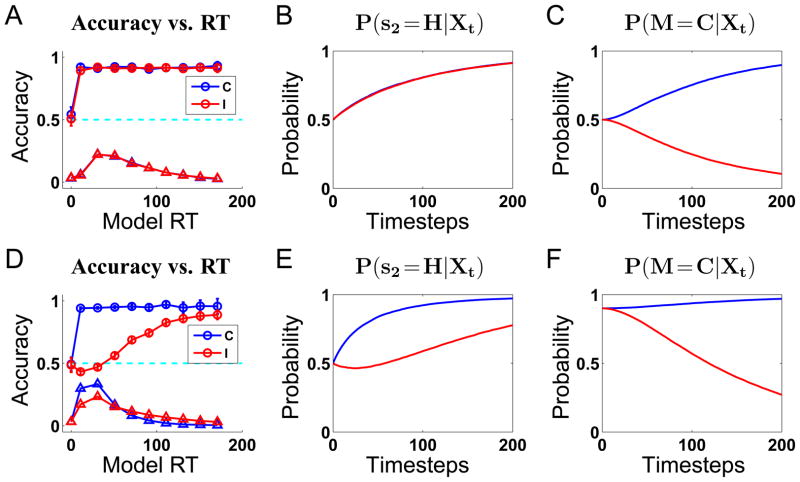
Figure 4.
Inferential performance for the compatibility bias model, with equal priors β =.5 (A,B,C), and biased priors β =.9 (D,E,F). (A) For equal priors, accuracy as a function of RT (○), and the RT distributions (△), are identical between compatible (blue) and incompatible (black) trials. Data averaged over 10000 trials and binned into 10 equally spaced bins for each of compatible and incompatible conditions, error bars are SEM. (B) The mean trajectories of the marginal posterior P(s2 = H|Xt) (correct answer) for the compatible (blue) and incompatible (black) conditions are identical. (C) The marginal posterior P(M =C|Xt) (compatible) rises from 0.5 toward 1 for compatible stimuli (blue), and falls toward 0 for incompatible (black), at an identical rate. (D) For biased priors, accuracy level is close to 1 in the compatible condition, except for the premature responses, which are at chance. In the incompatible condition, accuracy is below chance level for short react times, and rises toward 1 for trials with longer RT. The distribution of RT is broader and delayed for the incompatible condition compared the compatible condition. (E) The mean trajectories of the marginal posterior P(s2 = H|Xt) (correct answer) for the compatible condition rises steadily from 0.5 toward 1, while that for the incompatible condition first “dips” below 0.5, before climbing back up toward 1 as time passes. (F) The marginal posterior P(M =C|Xt) rises from β toward 1 for compatible trials, and falls toward 0 for the incompatible condition.

